BSF: Botnet Simulation Framework
BSF – Botnet Simulation Framework
BSF provides a discrete simulation environment to implement and extend peer-to-peer botnets, tweak their settings, and allow defenders to evaluate monitoring and countermeasures.
Synopsis
In the arms race between botmasters and defenders, the botmasters have the upper hand, as defenders have to react to actions and novel threats introduced by botmasters. The Botnet Simulation Framework (BSF) addresses this problem by leveling the playing field. It allows defenders to get ahead in the arms race by developing and evaluating new botnet monitoring techniques and countermeasures. This is crucial, as experimenting in the wild will interfere with other researchers and possibly alert botmasters.
BSF allows realistic simulation of peer-to-peer botnets to explore and study the design and impact of monitoring mechanisms and takedown attempts before being deployed in the wild. BSF is a discrete event botnet simulator that provides a set of highly configurable (and customizable) botnet features including:
- realistic churn behavior
- variable bot behavior
- monitoring mechanisms (crawlers and sensors)
- anti-monitoring mechanisms
Moreover, BSF provides an interactive visualization module to further study the outcome of a simulation. BSF is aimed at enabling researchers and defenders to study the design of the different monitoring mechanisms in the presence of anti-monitoring mechanisms [1,2,3]. Furthermore, this tool allows the users to explore and understand the impact of design choices of botnets seen to date.
Visualizing Results
The visualization is decoupled from the simulation framework and works on top of the generated graph and monitoring log files. We have also uploaded some sample data to explore the visualizations without running the main framework.
To visualize the results of the simulations you have to navigate to the visualization folder and call app.py. Afterward, open your favorite browser and open http://127.0.0.1:8050/. This should provide you with a graph view of one of the sample configurations looking something like this:
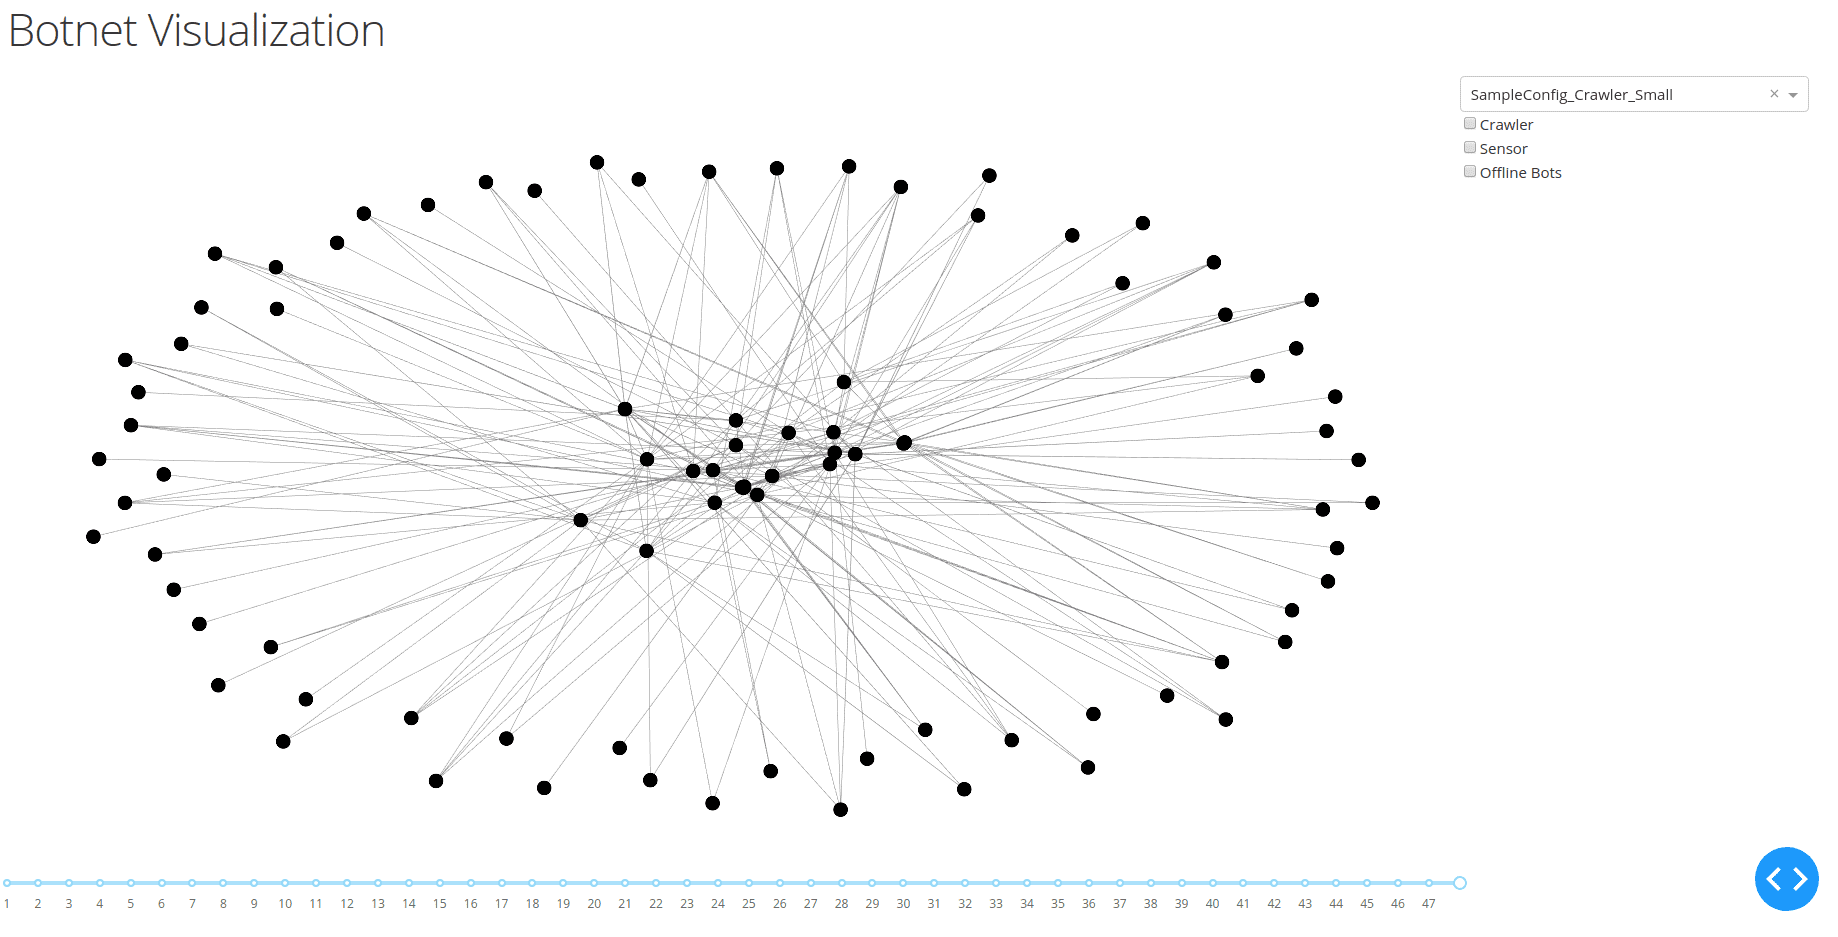
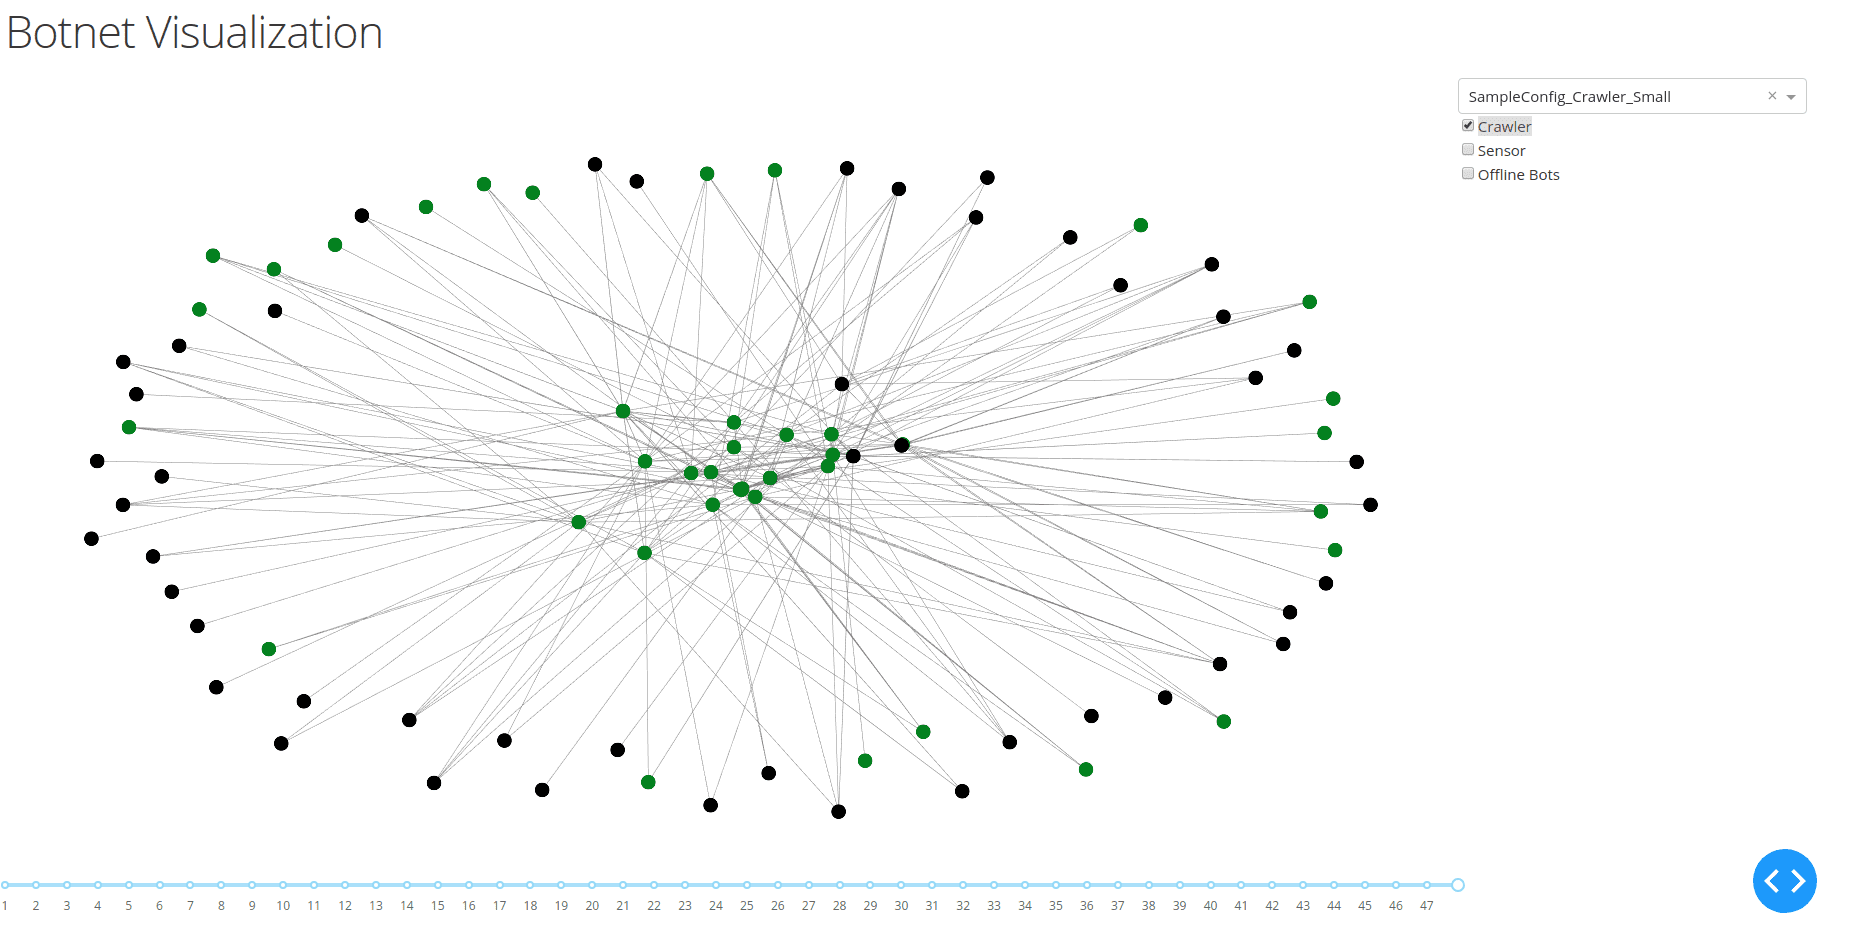
The dropdown menu in the top right of the screen allows you to choose between the results of different configurations. On the bottom of the screen, you can see a timeline indicating all available snapshots of the botnet. This allows us to visualize changes in the activity and connectivity of the bots. Furthermore, the menu on the right allows us to visualize the information collected by crawlers or sensors. An example can be seen in the following figure, where the view of the crawler is highlighted in green.
Install & Use
Copyright (c) 2019 Telecooperation Lab – TU Darmstadt