ntopng v6.0 releases: Web-based Traffic and Security Monitoring
ntopng
ntopng is the next-generation version of the original ntop, a network traffic probe that shows the network usage, similar to what the popular top Unix command does. ntopng is based on libpcap and it has been written in a portable way in order to virtually run on every Unix platform, MacOSX, and on Windows as well.
ntopng users can use a web browser to navigate through ntop (that acts as a web server) traffic information and get a dump of the network status. In the latter case, ntopng can be seen as a simple RMON-like agent with an embedded web interface. The use of:
- a web interface.
- limited configuration and administration via the web interface.
- reduced CPU and memory usage (they vary according to network size and traffic).
What ntopng can do for me?
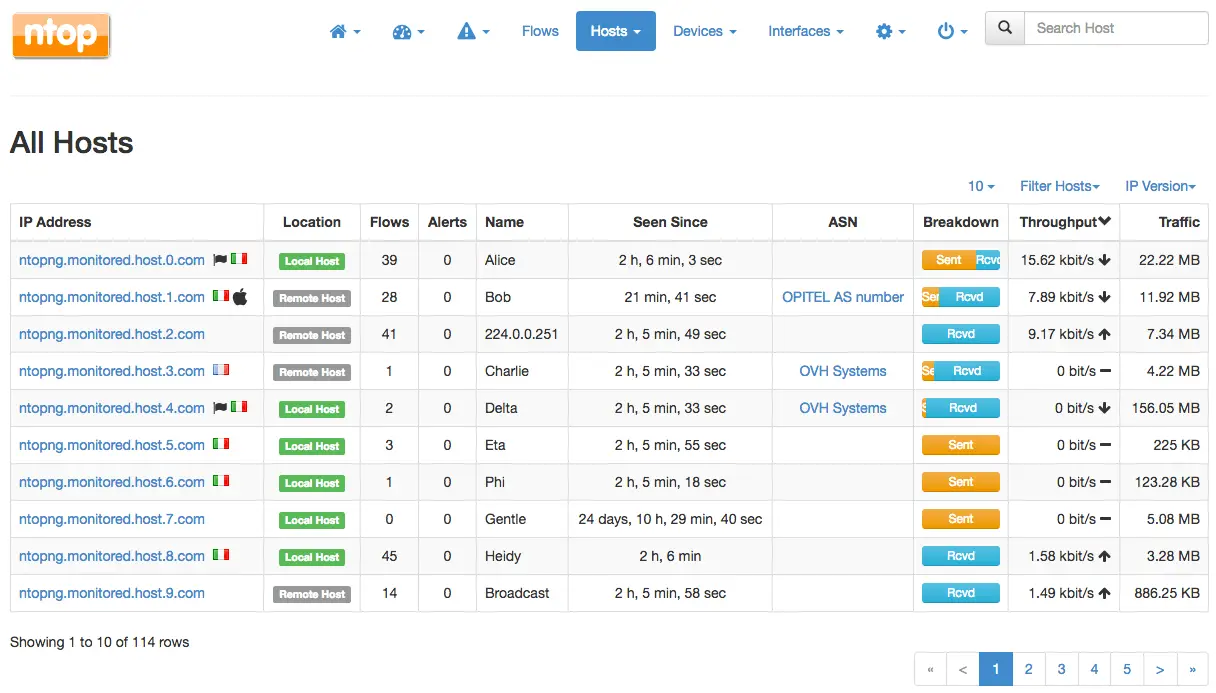
- Sort network traffic according to many criteria including IP address, port, L7 protocol, throughput, AS.
- Show network traffic and IPv4/v6 active hosts.
- Produce long-term reports about various network metrics such as throughput, application protocols
- Top X talkers/listeners, top ASs, top L7 applications.
- For each communication flow report network/application latency/RTT, TCP stats (retransmissions, packets OOO, packet lost), bytes/packets
- Store on disk persistent traffic statistics in RRD format.
- Geolocate hosts and display reports according to host location.
- Discover application protocols by leveraging on nDPI, ntop’s DPI framework.
- Characterise HTTP traffic by leveraging on characterisation services provided by Google and HTTP Blacklist.
- Show IP traffic distribution among the various protocols.
- Analyse IP traffic and sort it according to the source/destination.
- Display IP Traffic Subnet matrix (who’s talking to who?)
- Report IP protocol usage sorted by protocol type.
- Produce HTML5/AJAX network traffic statistics.
ntopng v6.0 releases.
Changelog
Breakthroughs
- New configurable Dashboard with new built-in templates
- New configurable Traffic Report
- New Vulnerability Scans & CVEs support
- Add support to Periodic Reports notified via Recipients (e.g. email)
- Add Inactive Hosts
- Add PagerDuty integration
- Add TheHive integration
- Add support to Modbus and Modbus alerts
- Add Server Ports Analysis page
- Enable multithreading in active measurements (more accurate)
- Migrate frontend chart timeseries library to Dygraph
- Add support for MAC Address based RADIUS accounting
- Improve OT, ICS, Scada support
- Trigger External Host alerts directly from Lua (also for inactive hosts)
- Add multicast forwarders
- Implement host blackhole
- Add support for LLDP id to MIB-II InterfaceId mapping
- Add support for bidirectional rules
- Add support for Enterprise XL bundle
- More…
Use Cases
Monitor a Physical Interface
A physical NIC card can be monitored simply by specifying its interface name as
./ntopng -i eth0
Flow Collection
Flow collection requires ntopng to be used in conjunction with nProbe which can act as probe/proxy. The communication between nProbe and ntopng takes place over ZeroMQ, a publish-subscribe protocol that allows ntopng to communicate with nProbe. An environment where a remote nProbe is physically monitoring from a NIC and sending monitored flows to ntopng can be deployed as
./nprobe -i eth1 –zmq tcp://192.168.1.1:5556
./ntopng -i tcp://192.168.1.1:5556
Copyright (C) 1998-2018 ntop
Source: https://github.com/ntop/