prometheus v2.50 releases: monitoring system and time series database
Prometheus
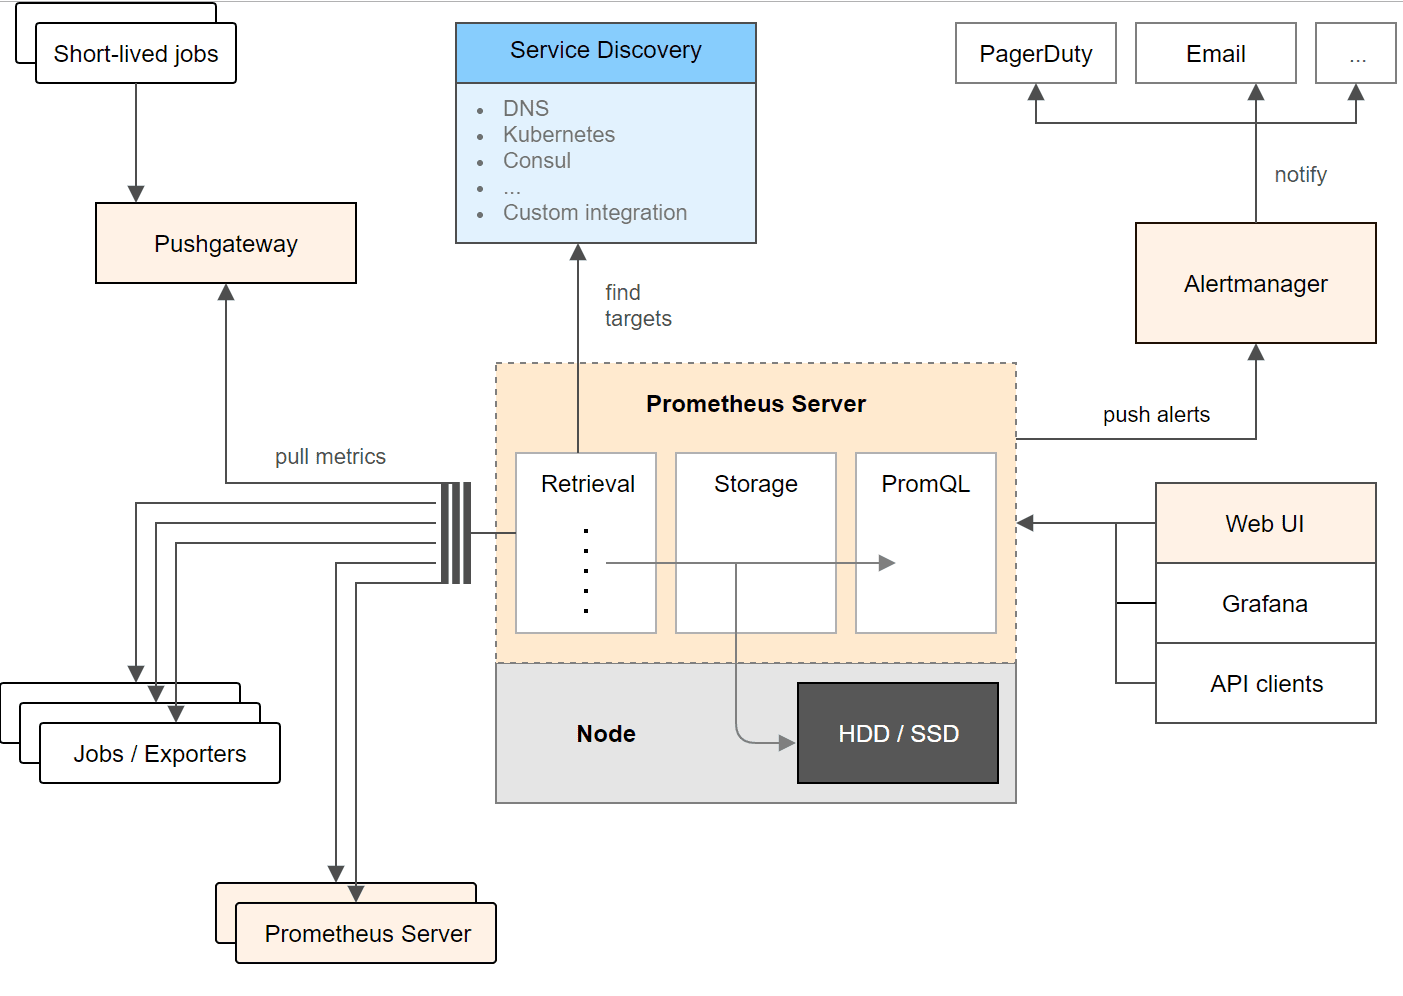
Prometheus, a Cloud Native Computing Foundation project, is a systems and service monitoring system. It collects metrics from configured targets at given intervals, evaluates rule expressions, displays the results, and can trigger alerts if some condition is observed to be true.
Prometheus’ main distinguishing features as compared to other monitoring systems are:
- a multi-dimensional data model (timeseries defined by metric name and set of key/value dimensions)
- a flexible query language to leverage this dimensionality
- no dependency on distributed storage; single server nodes are autonomous
- timeseries collection happens via a pull model over HTTP
- pushing timeseries is supported via an intermediary gateway
- targets are discovered via service discovery or static configuration
- multiple modes of graphing and dashboarding support
- support for hierarchical and horizontal federation
Feature
Dimensional data
Prometheus implements a highly dimensional data model. Time series are identified by a metric name and a set of key-value pairs.
Powerful queries
PromQL allows slicing and dicing of collected time series data in order to generate ad-hoc graphs, tables, and alerts.
Great visualization
Prometheus has multiple modes for visualizing data: a built-in expression browser, Grafana integration, and a console template language.
Efficient storage
Prometheus stores time series in memory and on local disk in an efficient custom format. Scaling is achieved by functional sharding and federation.
Simple operation
Each server is independent for reliability, relying only on local storage. Written in Go, all binaries are statically linked and easy to deploy.
Precise alerting
Alerts are defined based on Prometheus’s flexible PromQL and maintain dimensional information. An alertmanager handles notifications and silencing.
Many client libraries
Client libraries allow easy instrumentation of services. Over ten languages are supported already and custom libraries are easy to implement.
Many integrations
Existing exporters allow the bridging of third-party data into Prometheus. Examples: system statistics, as well as Docker, HAProxy, StatsD, and JMX metrics.
Changelog v2.50
- [CHANGE] Remote Write: Error
storage.ErrTooOldSampleis now generating HTTP error 400 instead of HTTP error 500. #13335 - [FEATURE] Remote Write: Drop old inmemory samples. Activated using the config entry
sample_age_limit. #13002 - [FEATURE] Experimental: Add support for ingesting zeros as created timestamps. (enabled under the feature-flag
created-timestamp-zero-ingestion). #12733 #13279 - [FEATURE] Promtool: Add
analyzehistograms command. #12331 - [FEATURE] TSDB/compaction: Add a way to enable overlapping compaction. #13282 #13393 #13398
- [FEATURE] Add automatic memory limit handling. Activated using the feature flag.
auto-gomemlimit#13395 - [ENHANCEMENT] Promtool: allow specifying multiple matchers in
promtool tsdb dump. #13296 - [ENHANCEMENT] PromQL: Restore more efficient version of
NewPossibleNonCounterInfoannotation. #13022 - [ENHANCEMENT] Kuma SD: Extend configuration to allow users to specify client ID. #13278
- [ENHANCEMENT] PromQL: Use natural sort in
sort_by_labelandsort_by_label_desc. This is experimental. #13411 - [ENHANCEMENT] Native Histograms: support
native_histogram_min_bucket_factorin scrape_config. #13222 - [ENHANCEMENT] Native Histograms: Issue warning if histogramRate is applied to the wrong kind of histogram. #13392
- [ENHANCEMENT] TSDB: Make transaction isolation data structures smaller. #13015
- [ENHANCEMENT] TSDB/postings: Optimize merge using Loser Tree. #12878
- [ENHANCEMENT] TSDB: Simplify internal series delete function. #13261
- [ENHANCEMENT] Agent: Performance improvement by making the global hash lookup table smaller. #13262
- [ENHANCEMENT] PromQL: faster execution of metric functions, e.g. abs(), rate() #13446
- [ENHANCEMENT] TSDB: Optimize label values with matchers by taking shortcuts. #13426
- [ENHANCEMENT] Kubernetes SD: Check preconditions earlier and avoid unnecessary checks or iterations in kube_sd. #13408
- [ENHANCEMENT] Promtool: Improve visibility for
promtool test ruleswith JSON colored formatting. #13342 - [ENHANCEMENT] Consoles: Exclude iowait and steal from CPU Utilisation. #9593
- [ENHANCEMENT] Various improvements and optimizations on Native Histograms. #13267, #13215, #13276 #13289, #13340
- [BUGFIX] Scraping: Fix quality value in HTTP Accept header. #13313
- [BUGFIX] UI: Fix usage of the function
time()that was crashing. #13371 - [BUGFIX] Azure SD: Fix SD crashing when it finds a VM scale set. #13578
Download && Use
© Prometheus Authors 2014-2019