 Do Son
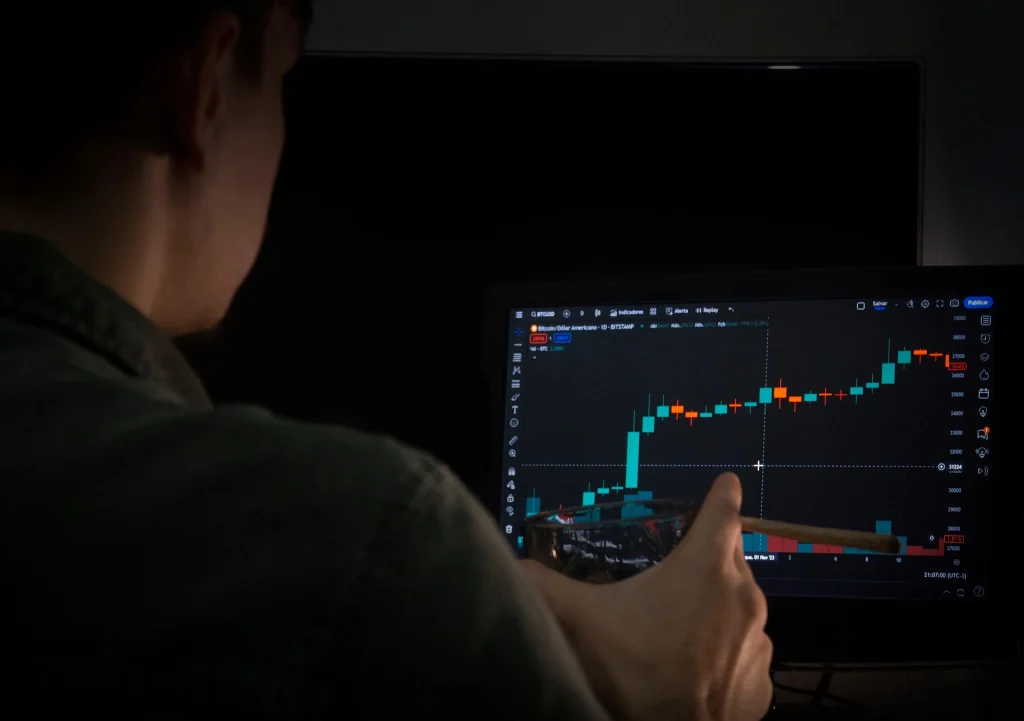
Forex markets move continuously as currencies respond to economic data, interest-rate expectations, geopolitical developments, and changing market sentiment. Understanding these movements requires more than watching individual price changes. Traders and market observers often study charts to identify patterns, momentum, support and resistance, and broader trends across different timeframes.
The growing use of live forex charts has made it easier to monitor currency movements as they develop. Real-time price information helps users observe changing market conditions, compare currency pairs, and study how price action responds to key economic events.
Reading Market Structure Through Real-Time Price Action
Understanding chart structure helps traders interpret changing currency movements while avoiding decisions based only on isolated price fluctuations.
1. Understanding Currency Pair Movements
Forex charts show the relationship between two currencies, with one currency quoted against another. Price changes indicate how that relationship shifts over time. Major pairs such as EUR/USD, GBP/USD, and USD/JPY often receive significant attention because of their liquidity and global relevance. Studying their movements across different periods can help observers recognise whether prices are trending, consolidating, or reversing.
2. Identifying Trends Across Timeframes
A trend becomes easier to understand when you examine price movement across multiple timeframes. Short-term charts can show immediate momentum, while longer-term charts provide broader context. Comparing hourly, daily, and weekly structures may reveal whether a recent move represents a larger trend or simply a temporary fluctuation. This approach helps create a more balanced interpretation of market behaviour, rather than relying on one isolated chart view.
3. Recognising Support And Resistance Areas
Support and resistance levels are commonly used to understand areas where price has previously encountered buying or selling pressure. These levels are not guaranteed turning points, but they can provide useful reference areas when studying historical price behaviour. Observing how currency pairs react around these zones can help traders understand momentum, consolidation, and potential changes in market structure.
4. Using Candlesticks To Study Price Behaviour
Candlestick charts show opening, closing, high, and low prices over a selected period. Their visual structure makes it easier to examine buying and selling pressure. Groups of candles can reveal momentum, consolidation, rejection, or potential shifts in direction. However, consider individual candlestick patterns within the broader market context rather than treating them as standalone signals.
5. Comparing Price Action With Market Events
Currency movements can change rapidly around major economic announcements. Inflation data, employment figures, gross domestic product releases, and central-bank decisions can influence expectations and currency valuations. An economic calendar can therefore provide useful context alongside price charts. Comparing the timing of significant announcements with subsequent price movement can help observers understand the relationship between fundamental developments and market behaviour.
Using Live Forex Charts For Informed Market Observation
Real-time charting provides a continuously updated view of currency prices, allowing users to monitor changing conditions rather than relying exclusively on historical snapshots. Live forex charts can help you compare currency pairs, observe intraday volatility, study technical structures, and connect price movements with economic developments.
Effective analysis still requires discipline. Charts can show what price has done and provide clues about market structure, but they cannot eliminate uncertainty. Current market conditions can change quickly following economic announcements or unexpected developments. Combining technical observations with fundamental context, appropriate risk management, and awareness of market volatility creates a more structured approach to forex analysis.
Technical Tools Supporting More Detailed Chart Analysis
Technical analysis becomes more useful when traders combine price structure with carefully selected indicators rather than depending on a single measurement.
1. Using Moving Averages For Trend Context
Moving averages smooth historical price data to make broader market direction easier to observe. Traders may compare shorter and longer averages to understand momentum and trend structure. These tools can be applied across different timeframes, although they remain based on historical prices and should not be treated as guarantees of future movement. Their main value is providing additional context alongside direct price analysis.
2. Studying Momentum Indicators
Momentum indicators can help traders examine the strength or speed of price movements. Tools such as the Relative Strength Index can highlight periods when price moves strongly in one direction. These readings may help identify changing momentum, but they require context because strong trends can remain extended for considerable periods. Combining momentum information with price structure can provide a more complete analytical picture.
3. Examining Volume-Related Information
Forex analysis differs from many centralised markets because currency trading spans multiple venues. As a result, volume information may not represent the entire global market. Traders should understand what a particular volume measure represents before drawing conclusions. Price action, liquidity conditions, and economic developments can provide additional context when evaluating currency movements.
4. Comparing Multiple Currency Pairs
Studying several related currency pairs can reveal broader market relationships. For example, US dollar moves can influence multiple major pairs simultaneously. Comparing pairs can help observers determine whether a move is specific to one currency or tied to broader market sentiment. Cross-pair analysis can therefore provide additional context when interpreting unusual or rapid price movements.
5. Tracking Changing Market Expectations
Forex prices often respond to expectations rather than confirmed economic outcomes alone. Traders monitor inflation, interest rates, employment conditions, and central-bank communication because these factors can influence expectations surrounding future monetary policy. Recent market commentary has continued to focus on central-bank decisions and economic releases as important potential catalysts for major currency pairs.
Conclusion: Building A Clearer View Of Forex Trends
Understanding forex markets requires a combination of price observation, trend analysis, technical tools, and awareness of economic developments. Charts can help users identify market structure, compare timeframes, recognise support and resistance, and examine momentum. However, no single indicator or pattern can reliably predict future currency movements.
Using live forex charts alongside economic calendars and broader market information can provide a more complete view of changing conditions. Traders and learners can use these tools to study price behaviour, evaluate different currency pairs, and develop a disciplined analytical process while remaining aware that forex markets involve substantial uncertainty and risk.