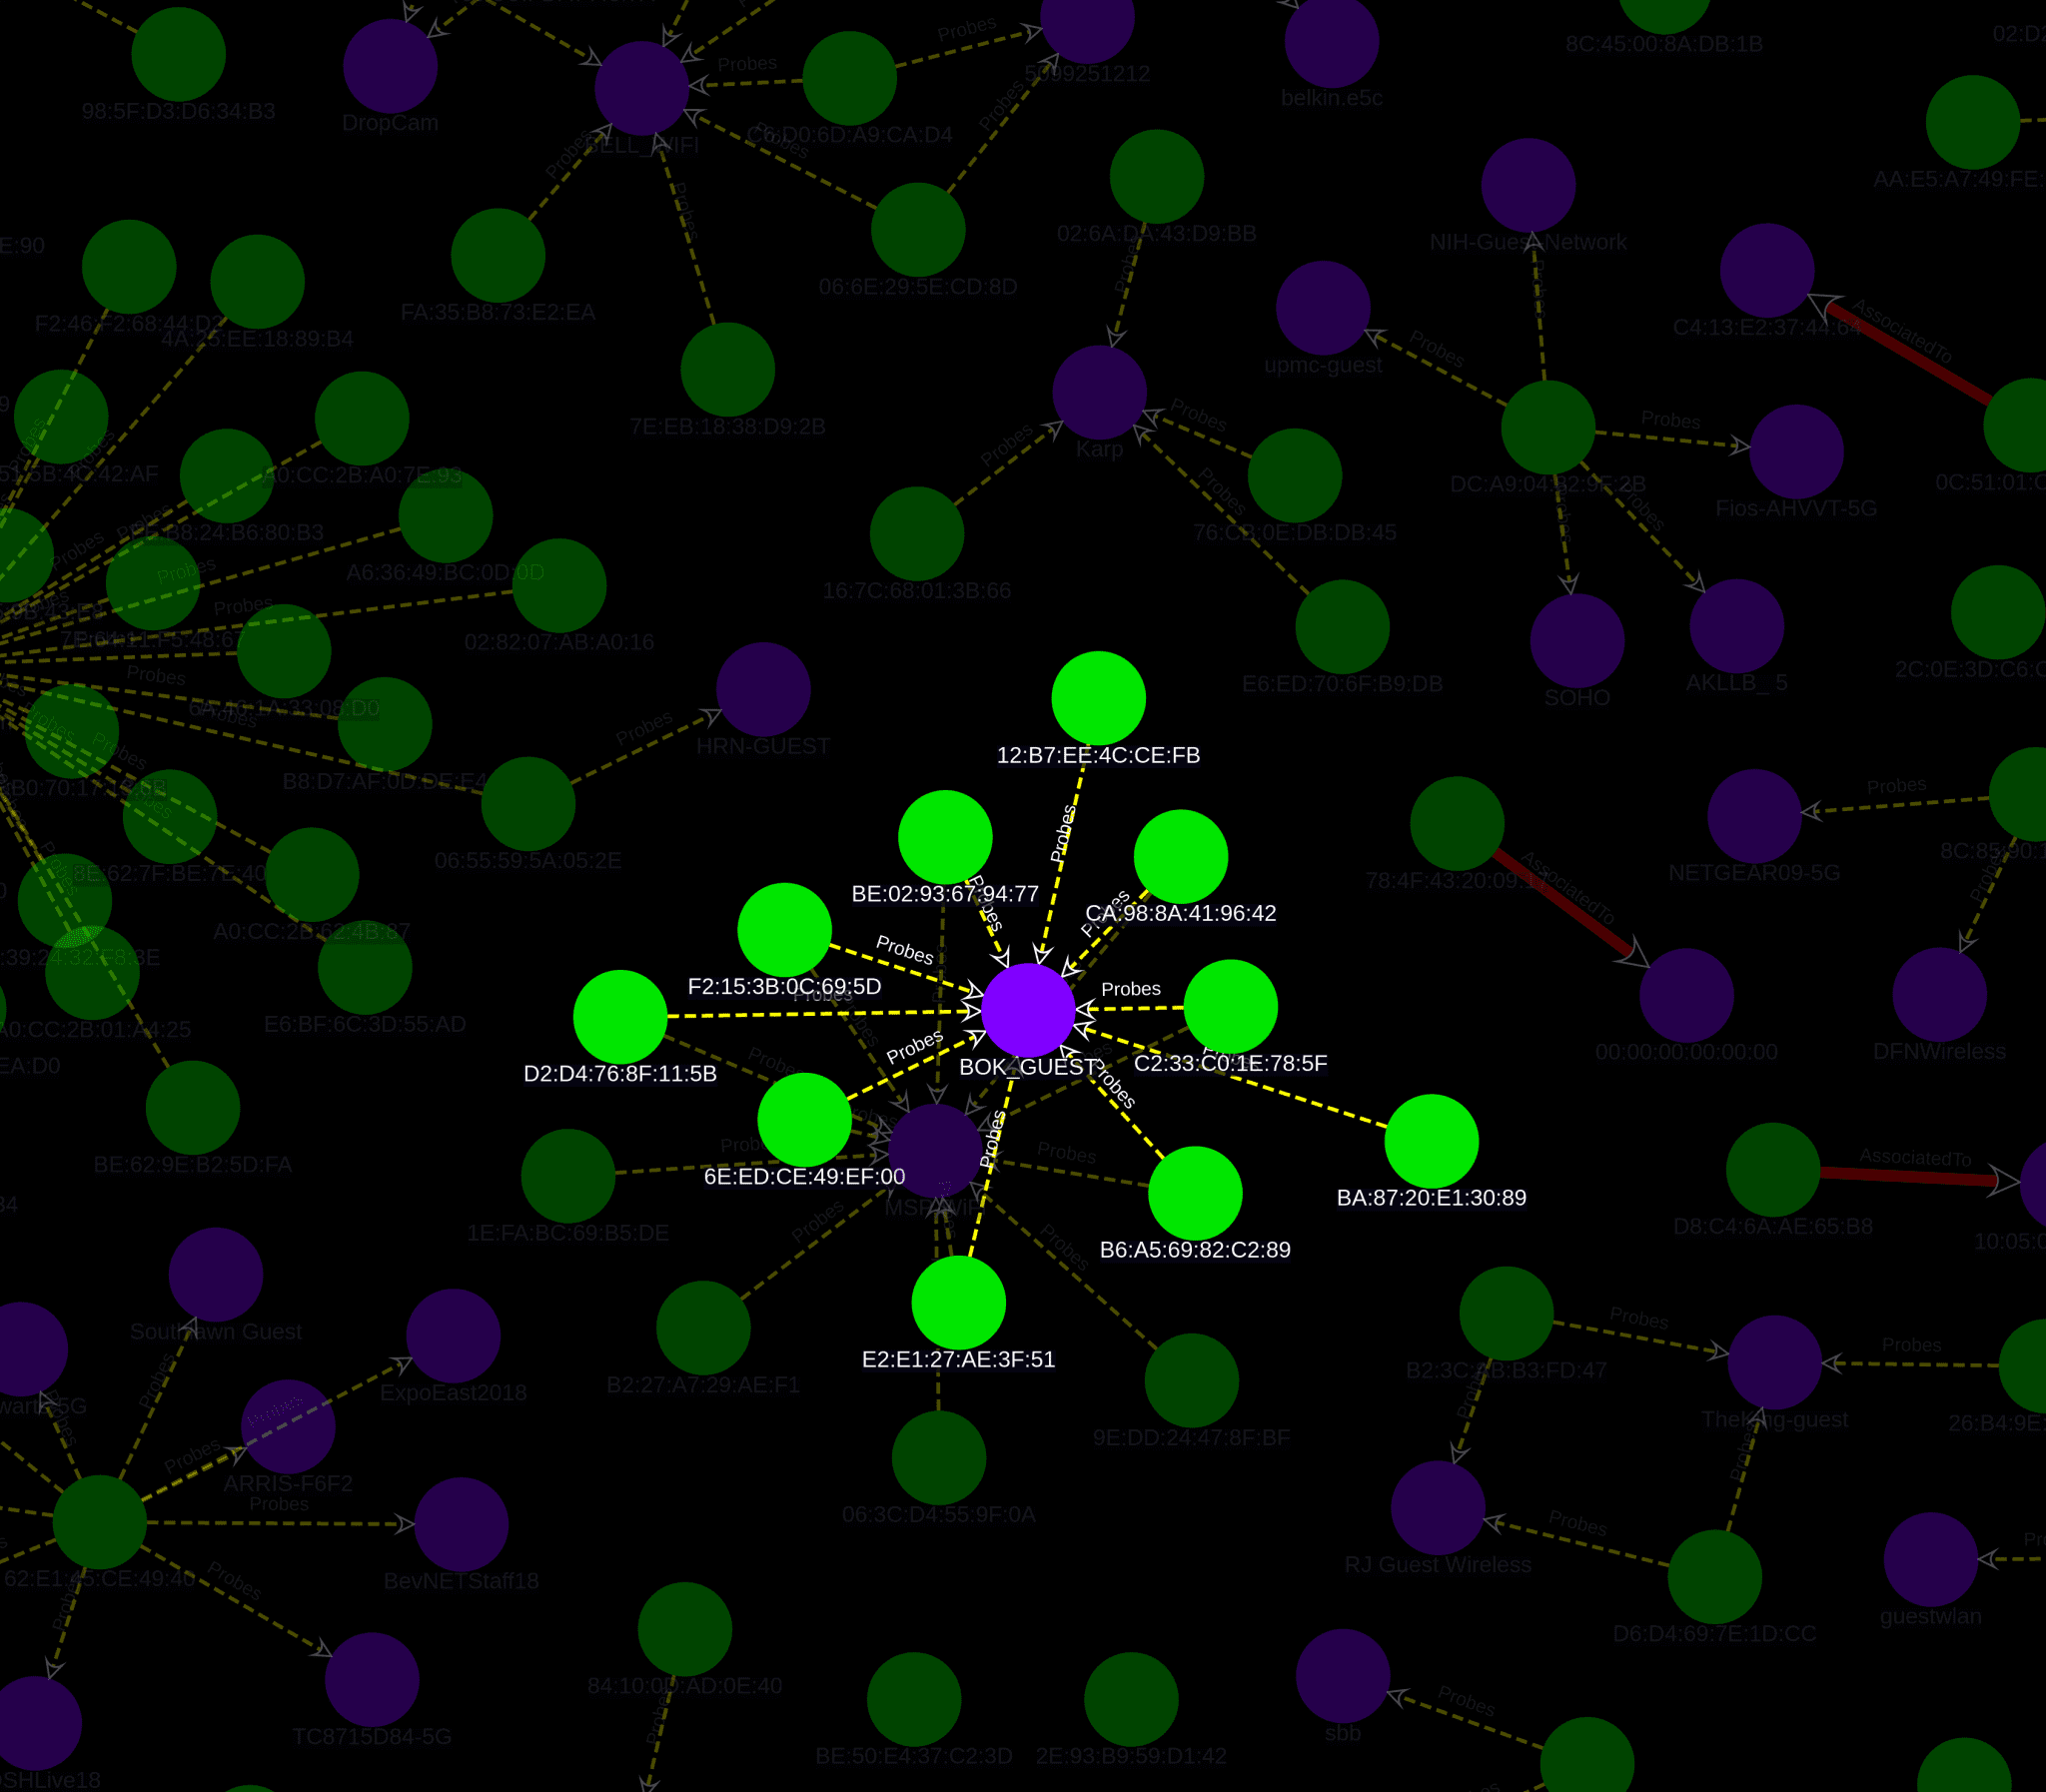
BeaconGraph v1.0 beta releases: Graph visualization of wireless client and access point relationships

BEACONGRAPH
BeaconGraph is an interactive tool that visualizes client and Access Point relationships. Inspired by airgraph-ng and Bloodhound, it aims to support wireless security auditing. It is written in Python with GUI support by pywebview and a Neo4j backend. Relationship rendering is supported by cytoscape.js and is served by Flask.

This tool is for
- An audit to verify the access points that portable devices have only connected to approved access points. If a device has an unapproved access point saved (like most users do), it’ll be easy to spot with BeaconGraph and “Probes” edges.
- An audit to look for unauthorized APs in an environment. Granted, there are other tools to assist with this but BeaconGraph provides nice visuals to use in reporting.
Changelog v1.0 beta
- Another complete overhaul of BeaconGraph. New frontend, backend, and deployed via Docker.
Install
git clone https://github.com/daddycocoaman/BeaconGraph.git
pip3 install -r requirements.txt
sudo apt-get install python3-pip python3-gi python-gi libwebkit2gtk-4.0-dev
pip3 install -r requirements-linux-gui.txt
pip3 install pywebview[qt5]
Usage
./beaconGraph.py <airodump CSV file>
–no-flush: Do NOT delete current database before adding new entries
—manuf: Update the Wireshark OUI Lookup file
—gui: Attempt to launch app in a GUI instead of browser (may not work)
–parse: Parse CSV files into neo4j database without launching app
-a or –airodump-csv: Airodump-ng formatted CSV

Copyright (C) 2019 daddycocoaman


