BlobRunner v0.0.5 releases: debug shellcode extracted during malware analysis

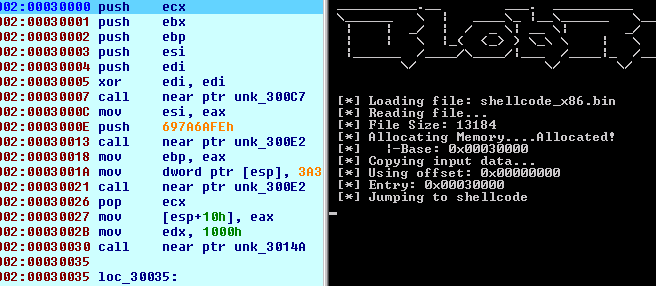
BlobRunner is a simple tool to quickly debug shellcode extracted during malware analysis. It allocates memory for the target file and jumps to the base (or offset) of the allocated memory. This allows an analyst to quickly debug into extracted artifacts with minimal overhead and effort.
Changelog v0.0.5
- BugFix #10 – –offset assumes base 16
- Remove call to VirtualProtect as the rights are already set to RWX in the call to VirtualAlloc
Usage
To debug:
- Open BlobRunner in your favorite debugger.
- Pass the shellcode file as the first parameter.
- Add a breakpoint before the jump into the shellcode
- Step into the shellcode
BlobRunner.exe shellcode.bin
Debug into a file at a specific offset.
BlobRunner.exe shellcode.bin --offset 0x0100
Debug into a file and don’t pause before the jump. Warning: Ensure you have a breakpoint set before the jump.
BlobRunner.exe shellcode.bin --nopause
Debugging x64 Shellcode
Inline assembly isn’t supported by the x64 compiler, so to support debugging into x64 shellcode the loader creates a suspended thread which allows you to place a breakpoint at the thread entry before the thread is resumed.
Remote Debugging Shell Blobs (IDAPro)
The process is virtually identical to debugging shellcode locally – with the exception that you need to copy the shellcode file to the remote system. If the file is copied to the same path you are running win32_remote.exe from, you just need to use the file name for the parameter. Otherwise, you will need to specify the path to the shellcode file on the remote system.
Copyright (c) 2017 OALabs
Source: https://github.com/OALabs/


