BlueHound v1.1.3 releases: helps blue teams pinpoint the security issues

BlueHound
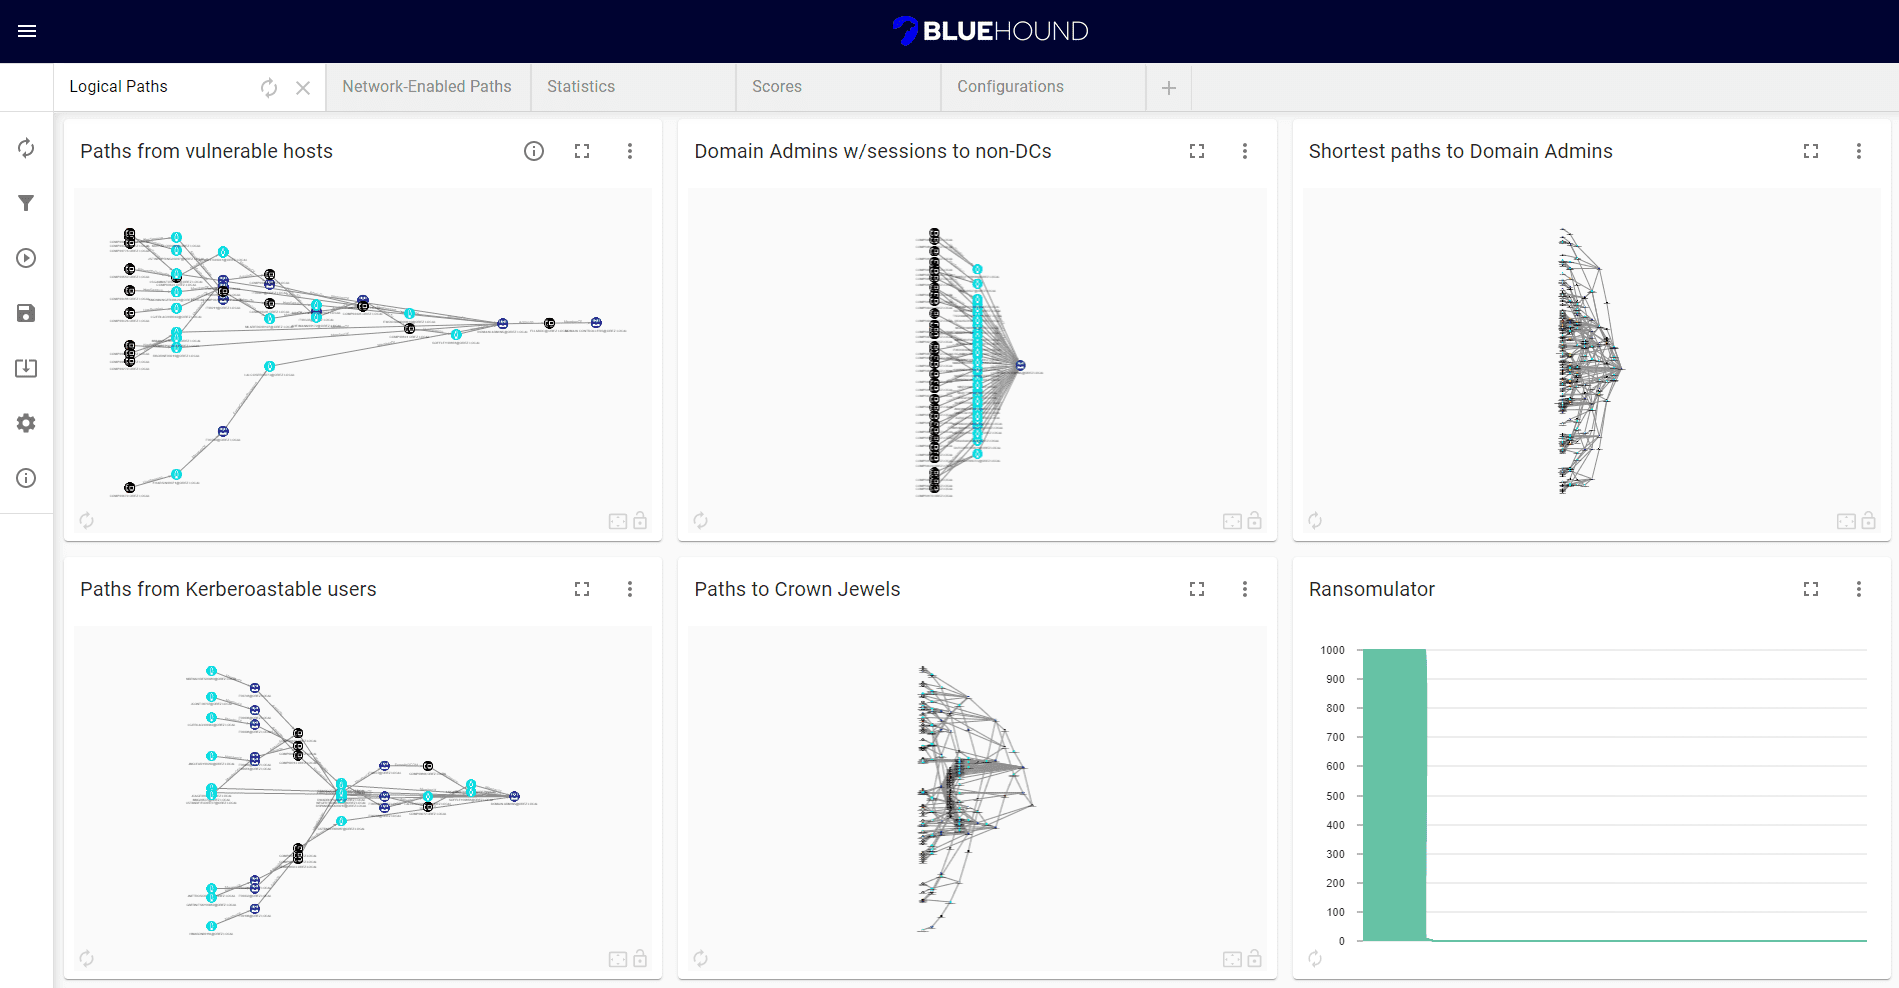
BlueHound is an open-source tool that helps blue teams pinpoint the security issues that actually matter. By combining information about user permissions, network access, and unpatched vulnerabilities, BlueHound reveals the paths attackers would take if they were inside your network
It is a fork of NeoDash, reimagined, to make it suitable for defensive security purposes.

BlueHound supports presenting your data as tables, graphs, bar charts, line charts, maps, and more. It contains a Cypher editor to directly write the Cypher queries that populate the reports. You can save dashboards to your database, and share them with others.
Main Features
- Full Automation: The entire cycle of collection, analysis, and reporting is basically done with a click of a button.
- Community Driven: BlueHound configuration can be exported and imported by others. Sharing of knowledge, best practices, collection methodologies, and more, are built into the tool itself.
- Easy Reporting: Creating customized reports can be done intuitively, without the need to write any code.
- Easy Customization: Any custom collection method can be added to BlueHound. Users can even add their own custom parameters or even custom icons for their graphs.
BlueHound How-To
Data Collection
The Data Import Tools section can be used to collect data at a click of a button. By default, BlueHound comes preconfigured with SharpHound, ShotHound, and the Vulnerability Scanners script. Additional tools can be added for more data collection. To get started:
- Download the relevant tools using the globe icon
- Configure the tool path & arguments for each tool
- Run the tools
The built-in tools can be configured to automatically upload the results to your Neo4j instance.
Running & Viewing Queries
To get results for a chart, either use the Refresh icon to run a specific query or use the Query Runner section to run queries in batches. The results will be cached even after closing BlueHound and can be run again to get updated results.
Some charts have an Info icon that explains the query and/or provides links to additional information.
Adding & Editing Queries
You can edit the query for new and/or existing charts by using the Settings icon on the top right section of the chart. Here you can use any parameters configured with a Param Select chart, and any Edge Filtering string (see the section below).
Edge Filtering
Using the Edge Filtering section, you can filter out specific relationship types for all queries that use the relevant string in their query. For example, “:FILTERED_EDGES” can be used to filter by all the selected filters.
You can also filter by a specific category (see the Info icon) or even define your own custom edge filters.
Import & Export Config
The Export Config and Import Config sections can be used to save & load your dashboard and configurations as a backup, and even shared between users to collaborate and contribute insightful queries to the security community. Don’t worry, your credentials and data won’t be exported.
Note: any arguments for data import tools are also exported, so make sure you remove any secrets before sharing your configuration.
Settings
The Settings section allows you to set some global limits on query execution – maximum query time and a limit for returned results.
Changelog v1.1.3
- Bug fixes
Install & Use
Copyright 2022 Zero Networks


