BREAD: BIOS Reverse Engineering & Advanced Debugging

BREAD
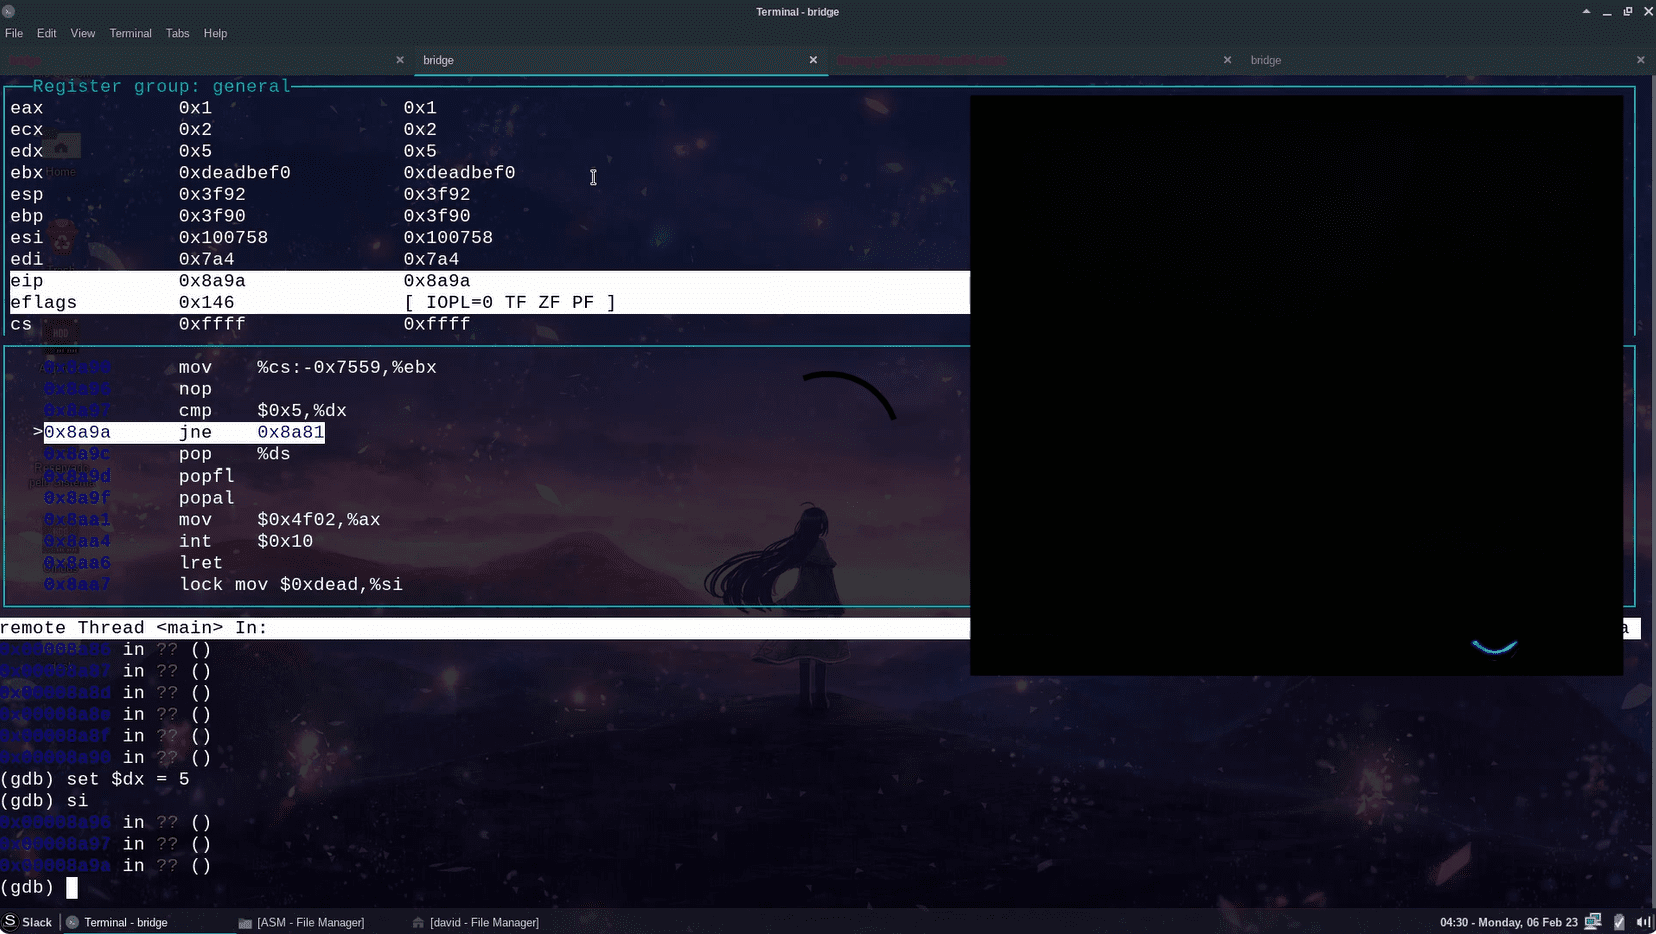
BREAD (BIOS Reverse Engineering & Advanced Debugging) is an ‘injectable’ real-mode x86 debugger that can debug arbitrary real-mode code (on real HW) from another PC via serial cable.
BREAD emerged from many failed attempts to reverse engineer legacy BIOS. Given that the vast majority — if not all — BIOS analysis is done statically using disassemblers, understanding the BIOS becomes extremely difficult, since there’s no way to know the value of registers or memory in a given piece of code.
Despite this, BREAD can also debug arbitrary code in real-mode, such as bootable code or DOS programs too.

How does it work?
This debugger is divided into two parts: the debugger (written entirely in assembly and running on the hardware being debugged) and the bridge, written in C and running on Linux.
The debugger is the injectable code, written in 16-bit real-mode, and can be placed within the BIOS ROM or any other real-mode code. When executed, it sets up the appropriate interrupt handlers, puts the processor in single-step mode, and waits for commands on the serial port.
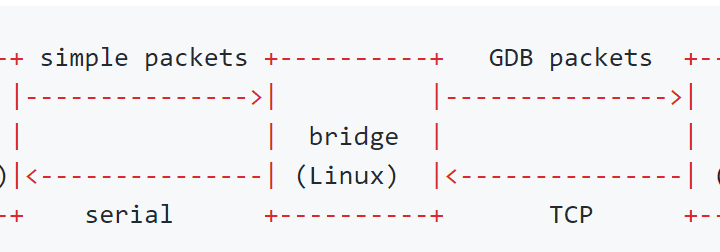
The bridge, on the other hand, is the link between the debugger and GDB. The bridge communicates with GDB via TCP and forwards the requests/responses to the debugger through the serial port. The idea behind the bridge is to remove the complexity of GDB packets and establish a simpler protocol for communicating with the machine. In addition, the simpler protocol enables the final code size to be smaller, making it easier for the debugger to be injectable into various different environments.
As shown in the following diagram:

Features
By implementing the GDB stub, BREAD has many features out-of-the-box. The following commands are supported:
- Read memory (via x, dump, find, and relateds)
- Write memory (via set, restore, and relateds)
- Read and write registers
- Single-Step (si, stepi) and continue (c, continue)
- Breakpoints (b, break)1
- Hardware Watchpoints (watch and its siblings)2
Limitations
How many? Yes. Since the code being debugged is unaware that it is being debugged, it can interfere with the debugger in several ways, to name a few:
-
Protected-mode jump: If the debugged code switches to protected-mode, the structures for interrupt handlers, etc. are altered and the debugger will no longer be invoked at that point in the code. However, it is possible that a jump back to real mode (restoring the full previous state) will allow the debugger to work again.
-
IDT changes: If for any reason the debugged code changes the IDT or its base address, the debugger handlers will not be properly invoked.
-
Stack: BREAD uses a stack and assumes it exists! It should not be inserted into locations where the stack has not yet been configured.
For BIOS debugging, there are other limitations such as: it is not possible to debug the BIOS code from the very beggining (bootblock), as a minimum setup (such as RAM) is required for BREAD to function correctly. However, it is possible to perform a “warm-reboot” by setting CS:EIP to F000:FFF0. In this scenario, the BIOS initialization can be followed again, as BREAD is already properly loaded. Please note that the “code-path” of BIOS initialization during a warm-reboot may be different from a cold-reboot and the execution flow may not be exactly the same.
Install & Use
Copyright (c) 2023 Davidson Francis <davidsondfgl@gmail.com>


