Dispatches from Drovorub: Network Threat Hunting for Russia GRU GTsSS’ Malware at Scale
Recently, the National Security Agency and Federal Bureau of Investigation released a report outlining command and control capabilities leveraged by the Russian General Staff Main Intelligence Directorate (GRU) 85th Main Special Service Center (GTsSS), military unit 26265 to interfere with the 2016 U.S. Presidential election. While this report contained technical details outlining the malware technologies, the report did not provide a network-scale tool ready for network-based threat hunting. Today, Insane Forensics makes public a free, open-source tool to assist with scaled network detection and response for GRUs Drovorub malware using Elasticsearch and Kibana. The provided tool works on existing network captures (pcap files) and also supports live capture mode.
Included in this Toolkit
- A python script to load previously collected pcap data or listen live on an interface
- Elasticsearch index mapping
- Kibana dashboards for analyst
Data Analysis Techniques
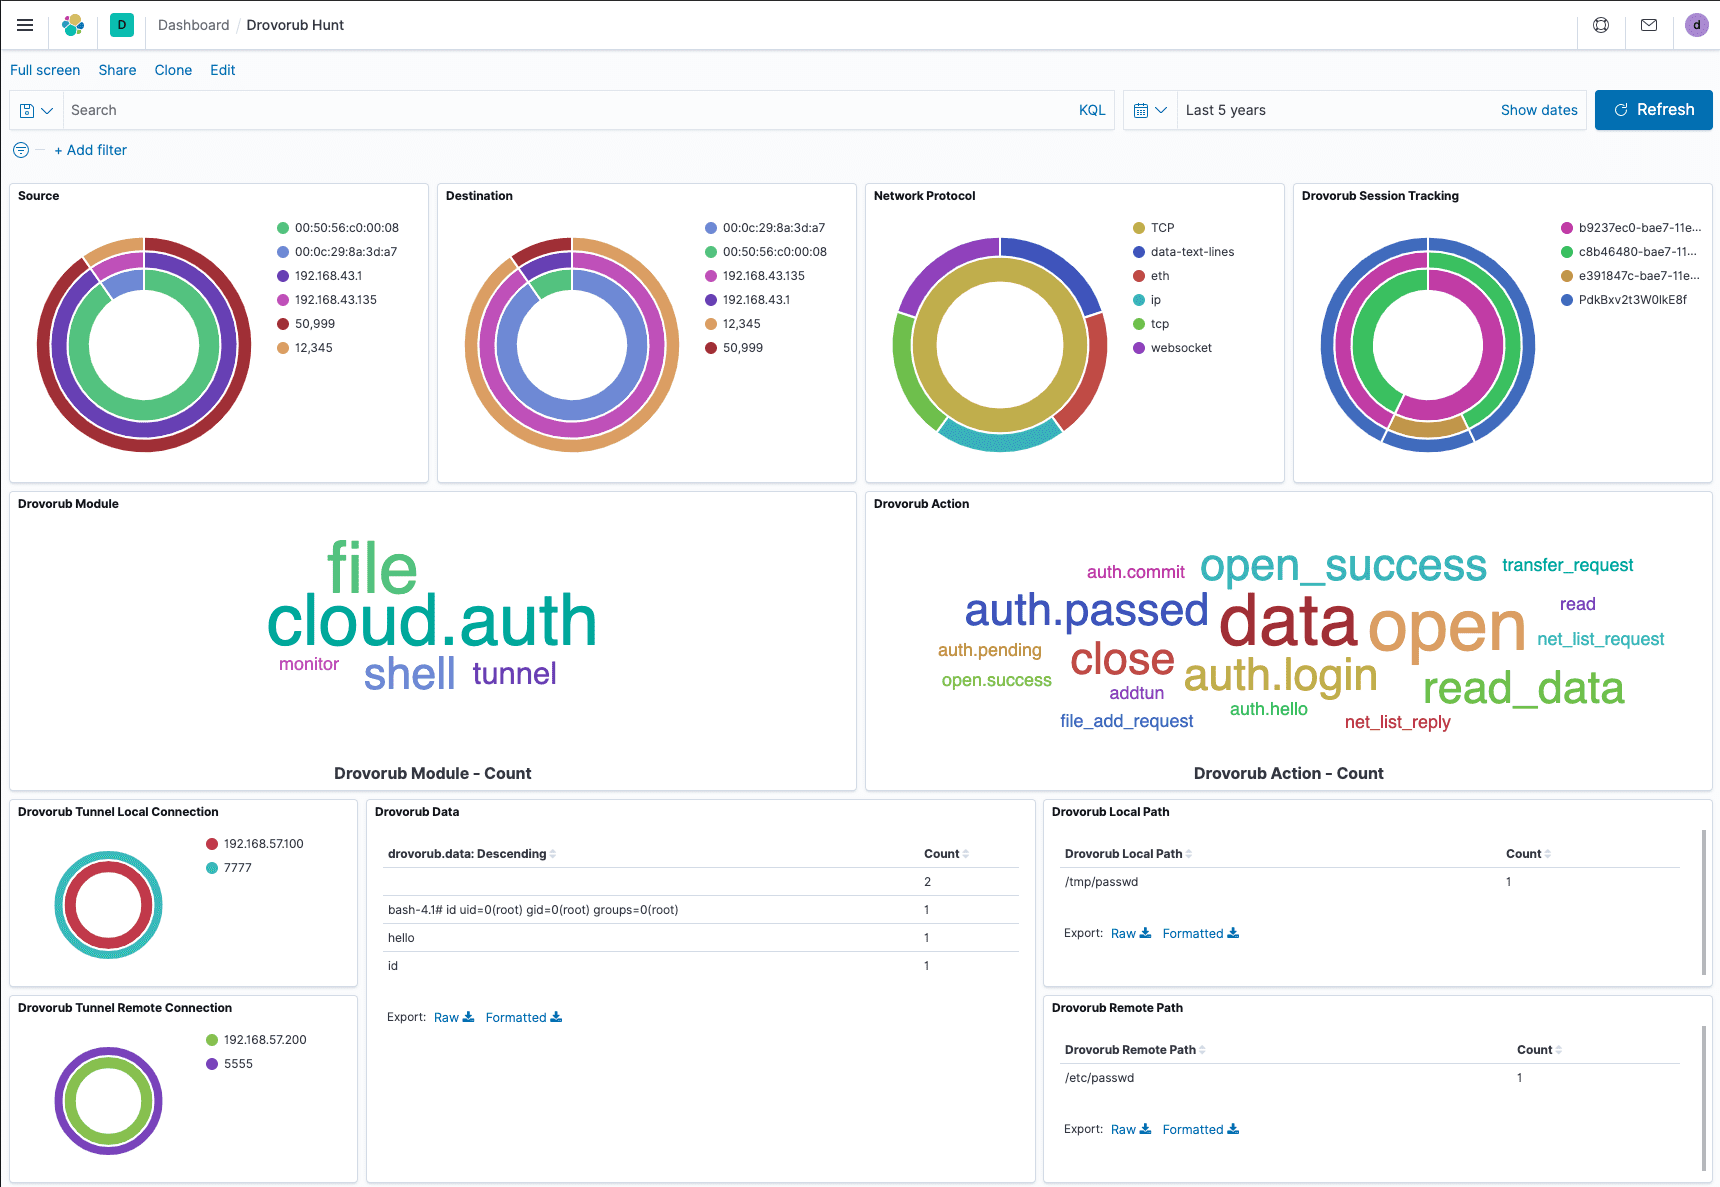
The provided dashboard allows for primary hunting and response techniques covering Drovorub’s command and control (c2). Drovorub C2 uses the WebSockets protocol outlined in RFC 6455. All WebSocket communications will appear in the source, destination, and network protocol panels of the provided dashboard. We came to this design decision in wanting to allow a wider aperture on potential unknown or undecoded WebSocket communications beyond known communication formats outlined in the report.
As a network analyst, you should try to understand the difference between healthy and abnormal WebSocket communications in your environment. The innermost ring of the source and destination panes shows the mac addresses of communicating assets. The middle circle shows IP addresses, and the outer ring shows the port. For the network protocol pane, the inner ring shows the transport protocol while the outer ring shows the application-level protocols. You can pivot by clicking on any ring value or the values on the right.
Pivoting by Drovorub Communication Session
The pane titled Drovorub Session Tracking allows you to pivot between session IDs present in Drovorub C2 sessions. This pane can also show how many sessions are active across your environment and to a single host. The inner ring represents the destination ID, the middle ring represents the source ID, and the outer ring represents the session ID. In the dashboard shown, we see one session between two Drovorub communicating assets.
Pivoting by Drovorub Module and Action
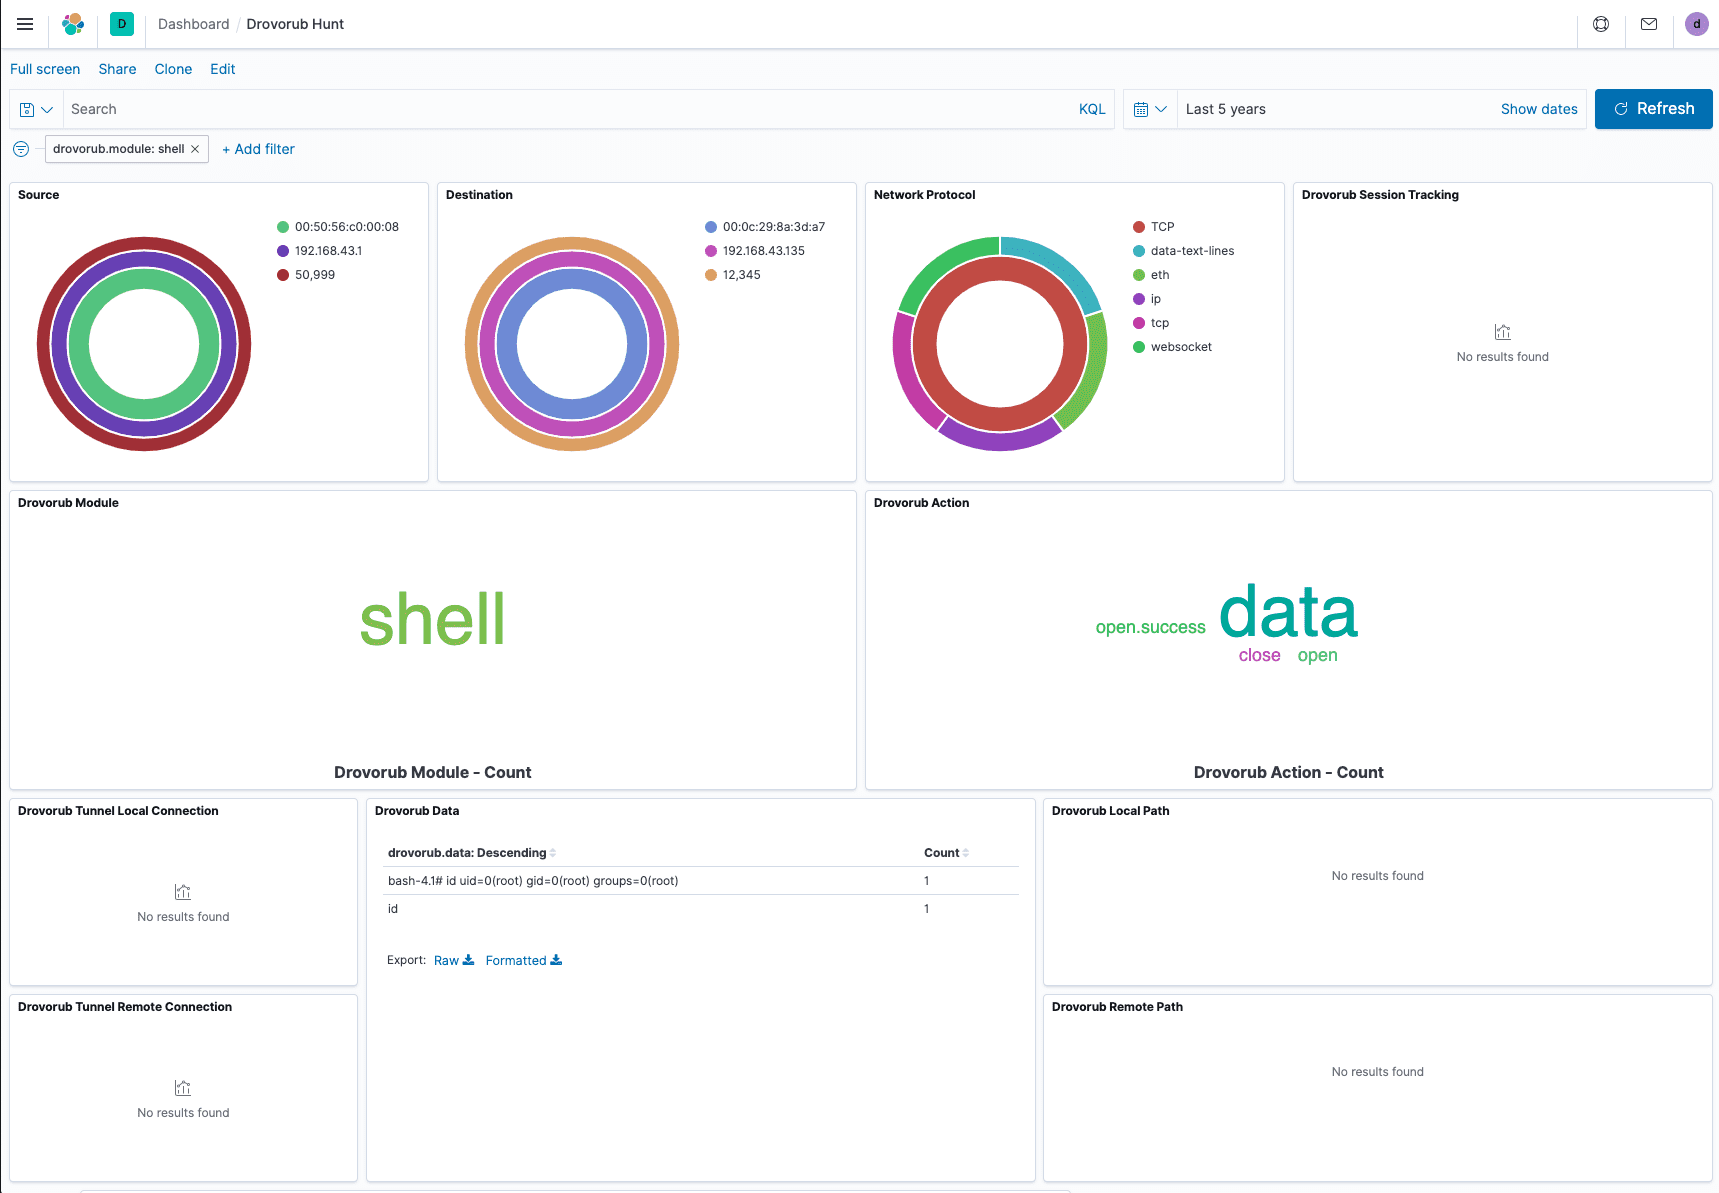
The module and action panes allow you to pivot by the Drovorub module or actions observed. Each panel represents a word cloud of the weighted count of each module or action seen. You can pivot on a particular module by merely clicking on it. Clicking applies a Kibana filter to the entire dashboard. In the image below, the active filter displays Drovorub shell module communication traffic. We can see quickly see shell module traffic between two hosts with a root level command prompt returned in the data field.
Viewing Parameter Data
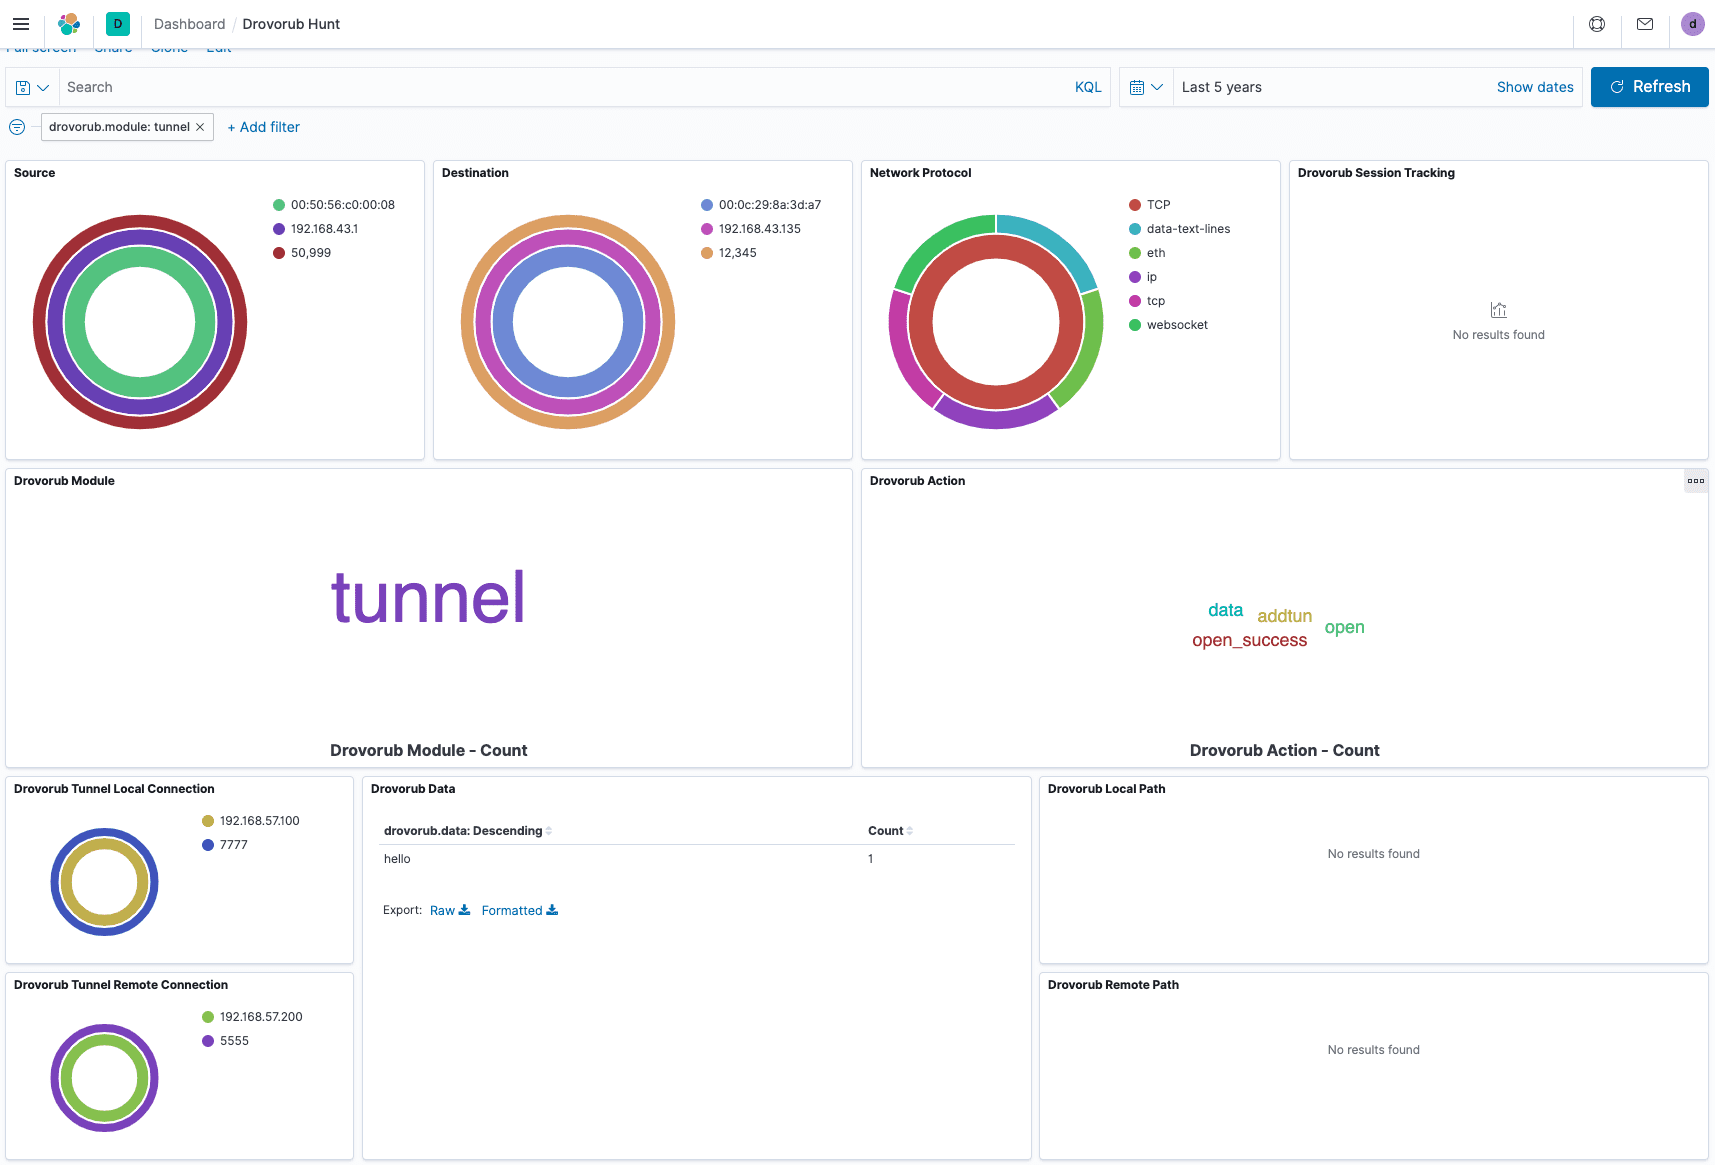
The rest of the dashboard displays a few parameters for various modules and actions. The tunnel local connection and tunnel remote connection panes above show tunnel information used by Drovorub’s tunnel module.
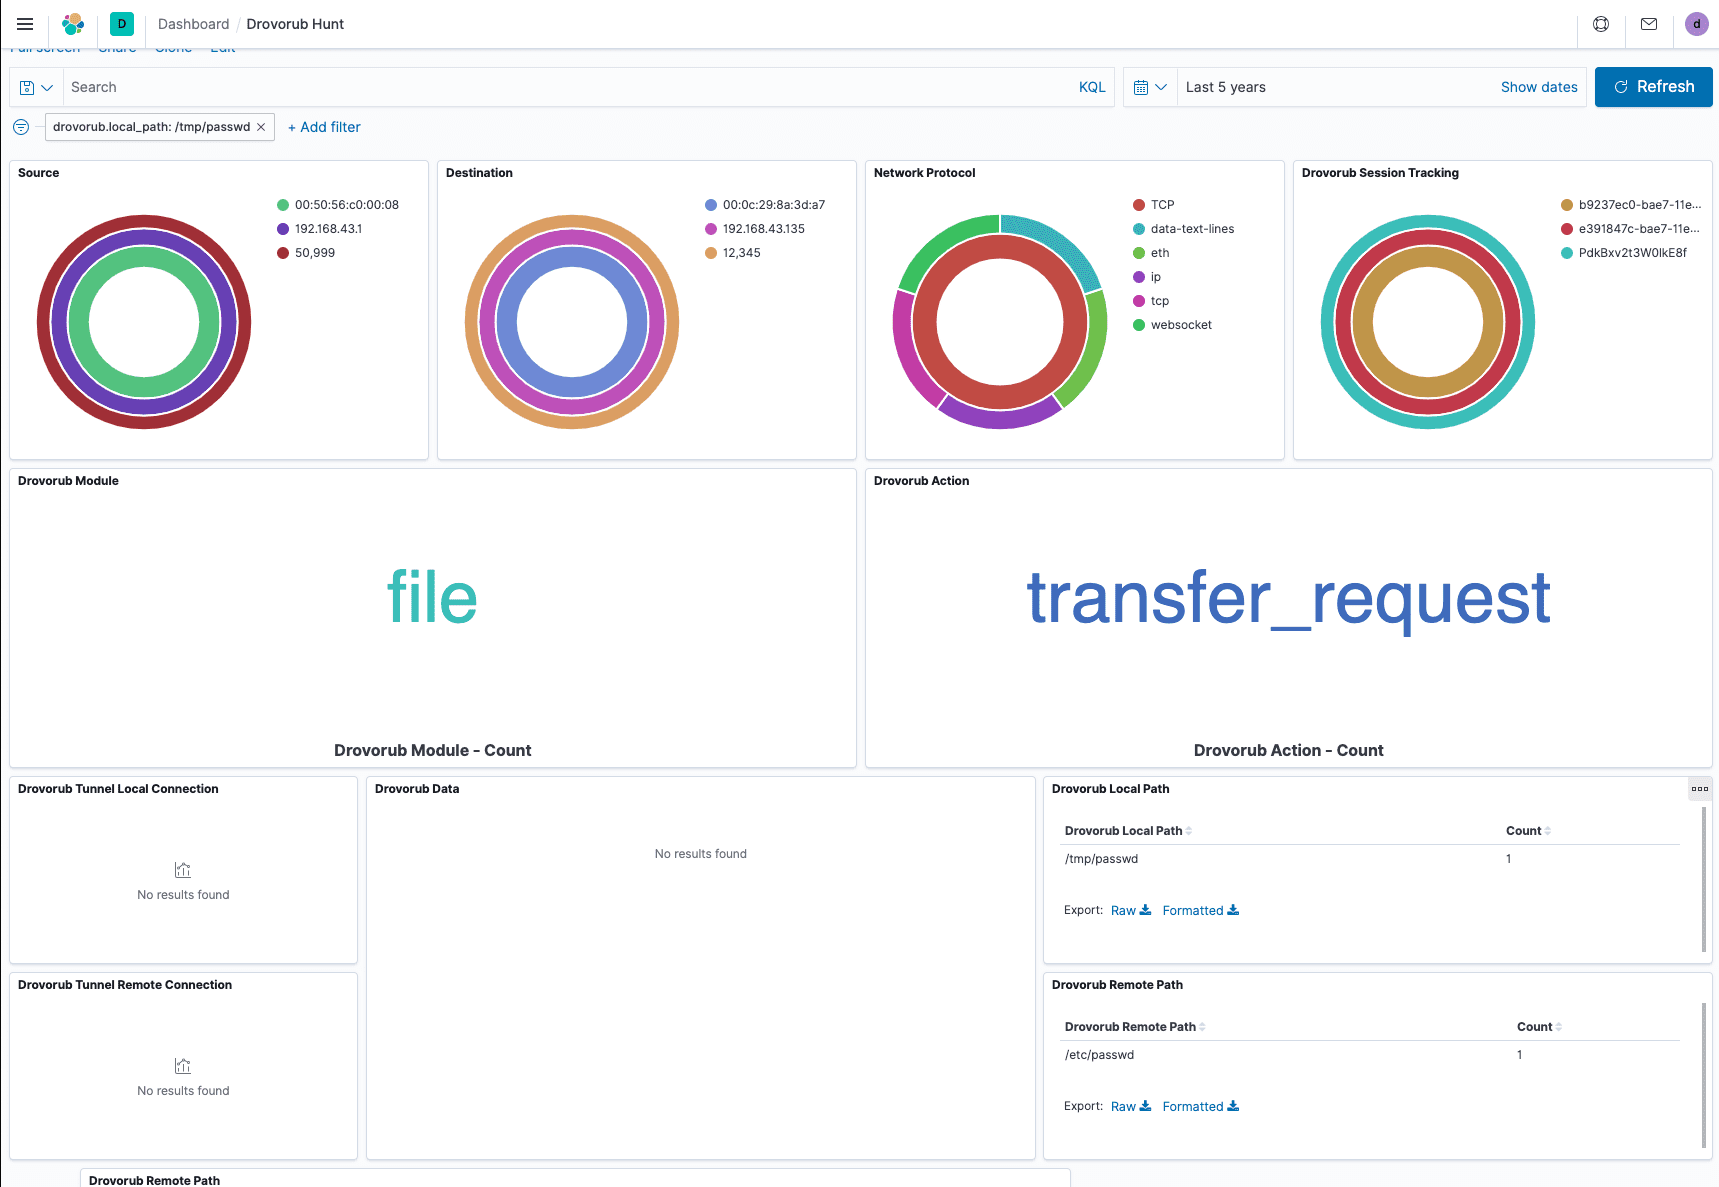
The local and remote path fields show information on what files were requested and where the files moved. In this case, the /etc/passwd file moved to /tmp/passwd.
Install && Use
Copyright (c) 2020 Insane Forensics


