grafana v10.1.5 releases: open-source platform for monitoring and observability
grafana
Grafana allows you to query, visualize, alert on, and understand your metrics no matter where they are stored. Create, explore, and share dashboards with your team and foster a data-driven culture:
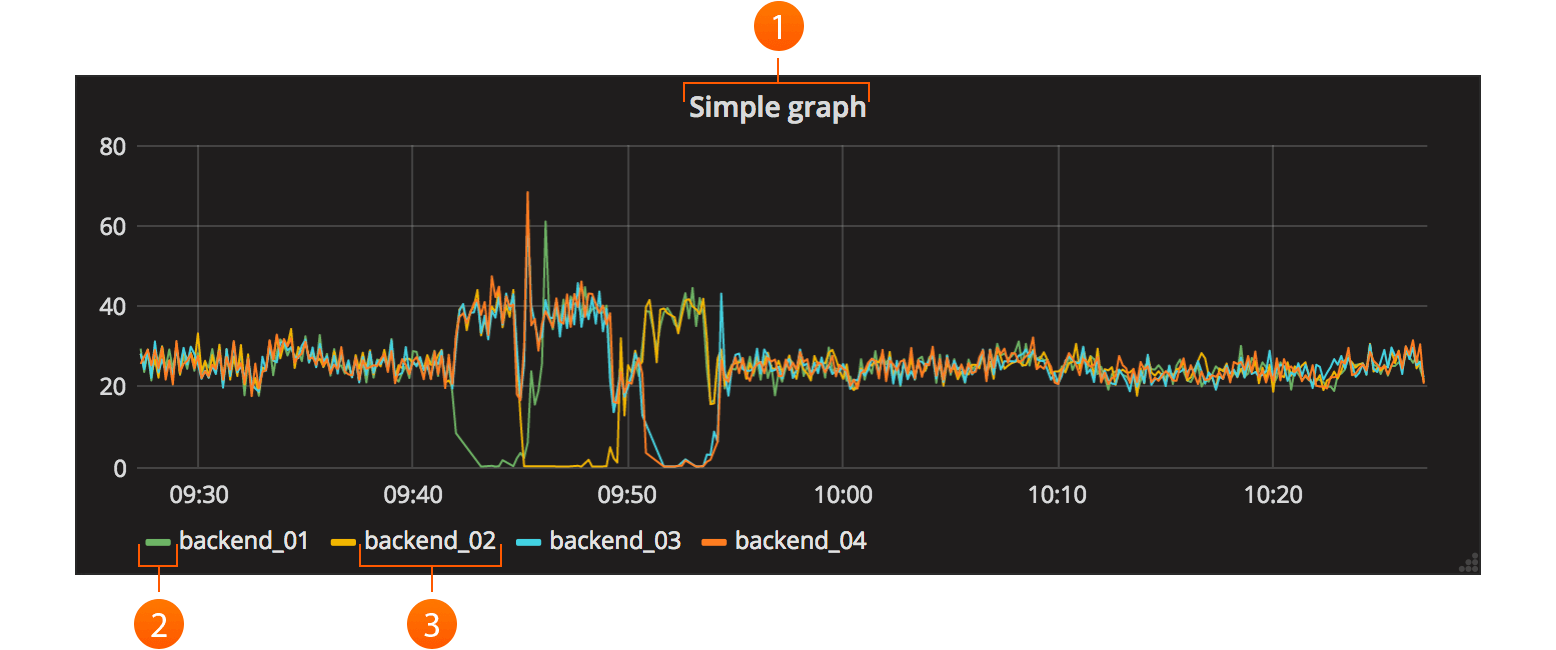
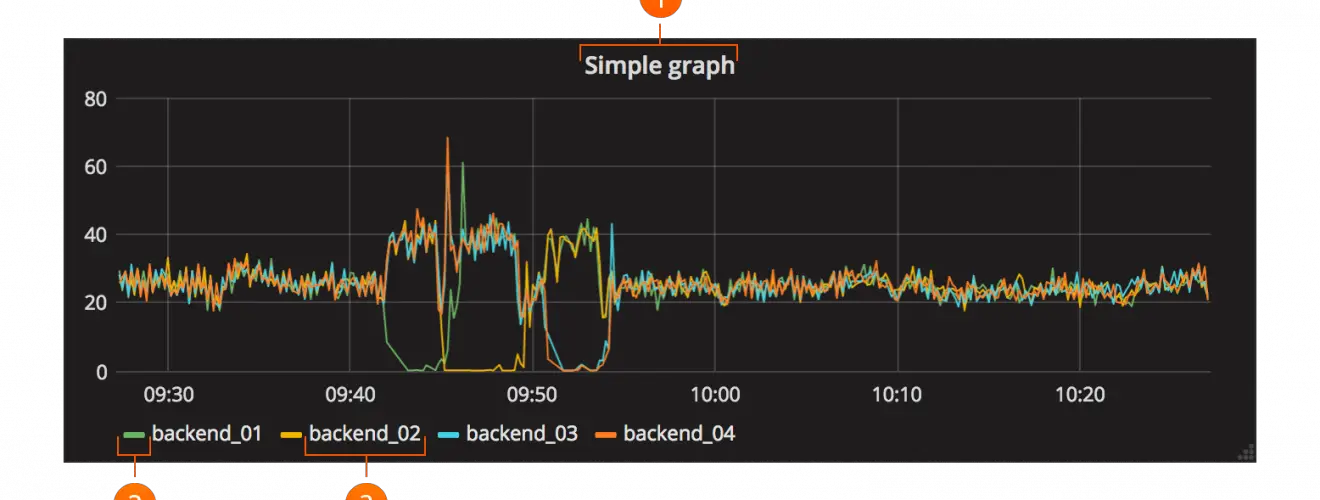
- Visualize: Fast and flexible client-side graphs with a multitude of options. Panel plugins for many different ways to visualize metrics and logs.
- Dynamic Dashboards: Create dynamic & reusable dashboards with template variables that appear as dropdowns at the top of the dashboard.
- Explore Metrics: Explore your data through ad-hoc queries and dynamic drilldown. Split view and compare different time ranges, queries and data sources side by side.
- Explore Logs: Experience the magic of switching from metrics to logs with preserved label filters. Quickly search through all your logs or streaming them live.
- Alerting: Visually define alert rules for your most important metrics. Grafana will continuously evaluate and send notifications to systems like Slack, PagerDuty, VictorOps, OpsGenie.
- Mixed Data Sources: Mix different data sources in the same graph! You can specify a data source on a per-query basis. This works for even custom datasources.
Changelog v10.1.5
Features and enhancements
- Chore: Upgrade Go to 1.20.10. #76355, @zerok
- Cloudwatch: Backport 73524 Bring Back Legacy Log Group Picker. #75031, @sarahzinger
Bug fixes
- Cloudwatch: Prevent log group requests with ARNs if feature flag is off. #75691, @sarahzinger
- Alerting: Add support for
keep_firing_forfield from external rulers. #75257, @rwwiv - Canvas: Avoid conflicting stylesheets when loading SVG icons. #75032, @adela-almasan
- Alerting: Prevent showing “Permissions denied” alert when not accurate. #74925, @VikaCep
- BrowseDashboards: Only remember the most recent expanded folder. #74809, @joshhunt
- Tempo Service Map: Fix context menu links in service map when namespace is present. #74796, @javiruiz01
- Logs Panel: Performance issue while scrolling within panel in safari. #74747, @gtk-grafana
- Bug: Allow to uninstall a deprecated plugin. #74704, @andresmgot
- Licensing: Pass func to update env variables when starting plugin. #74678, @leandro-deveikis
- Nested folders: Fix folder hierarchy in folder responses. #74580, @papagian
- Share link: Use panel relative time for direct link rendered image. #74518, @Clarity-89
- Alerting: Do not exit if Redis ping fails when using redis-based Alertmanager clustering. #74399, @alexweav
- Alerting: Refactor AlertRuleForm and fix annotations step description for cloud rules. #74193, @soniaAguilarPeiron
- RBAC: Chore fix hasPermissionInOrg. (Enterprise)
- Licensing: Updated grpc plugin factory newPlugin signature. (Enterprise)
- Reporting: Add support for old dashboard schema. (Enterprise)
Download && Use
Copyright 2015 Grafana Labs