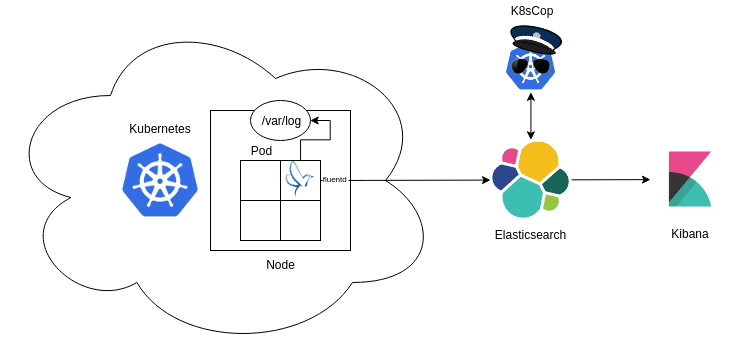
Kubernetes Security Dashboard
This guide assists in configuring a logging architecture for Kubernetes meant to store and parse audit logs. After setting up the logging architecture, run K8sCop for static or streaming analysis, and import the security dashboard in Kibana to obtain full visibility over Kubernetes cluster activity.
Feature
- Make the
kube-apiserverstore audit logs - Set up Elasticsearch and Kibana outside or inside Kubernetes
- Deploy the Fluent daemon to push logs to Elasticsearch
- Run K8sCop for static or streaming analysis of logs and labeling of events
- Import and view the Security Dashboard in Kibana
Preview
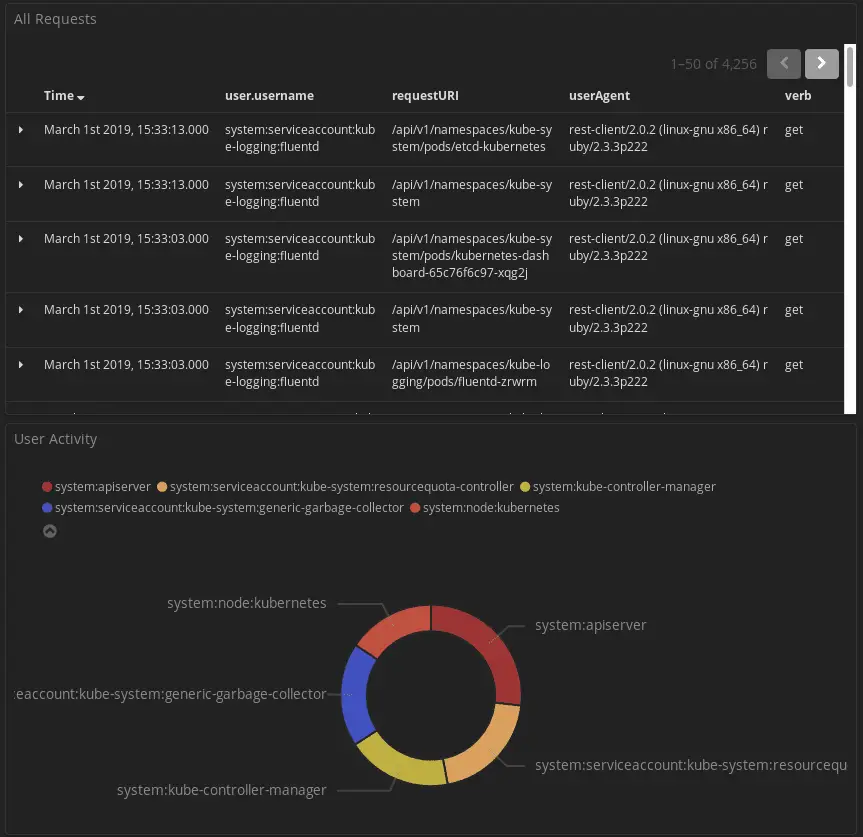
An overview of all requests made inside Kubernetes and a pie chart of user activity, computer by requests per user.
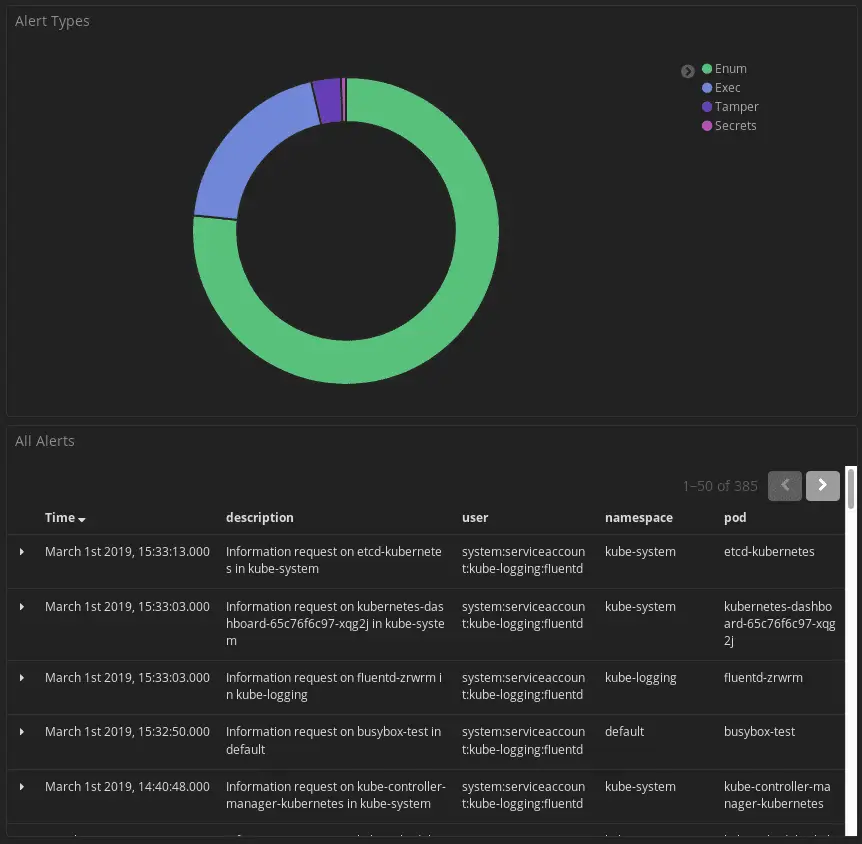
A pie chart of the different types of alerts and an overview of the latest alerts made by K8sCop.
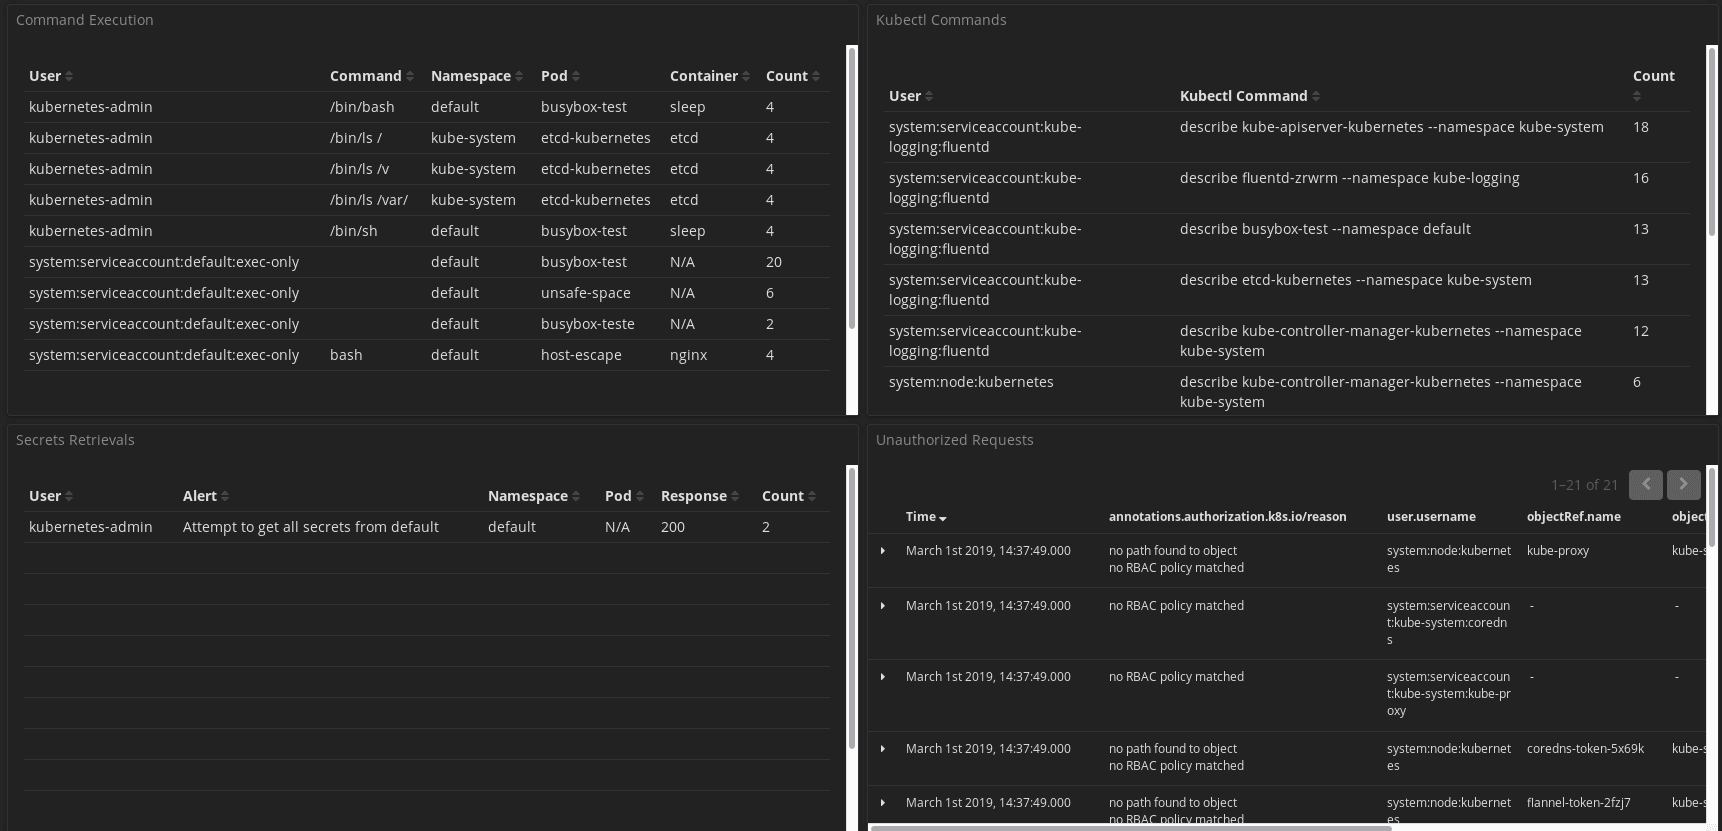
An overview of shell commands executed and kubectl interaction, with a list of attempts at secrets retrieval and requests that have been unauthorized.
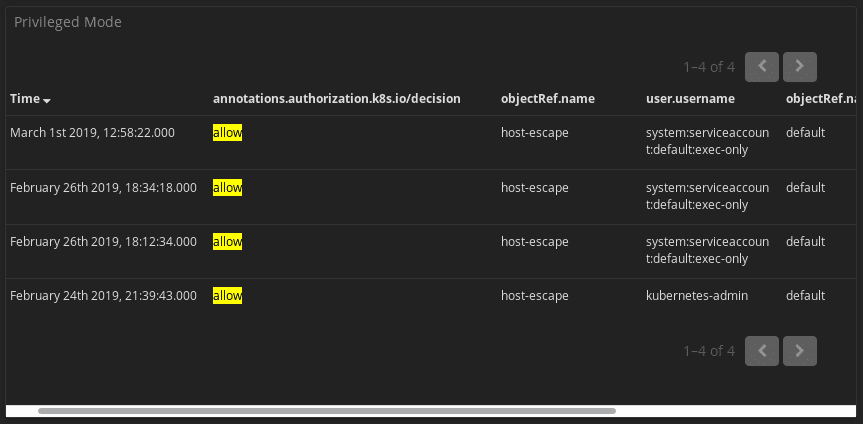
An overview of privileged pod spawning.
Install & Tutorial
Copyright (C) 2019 k8scop