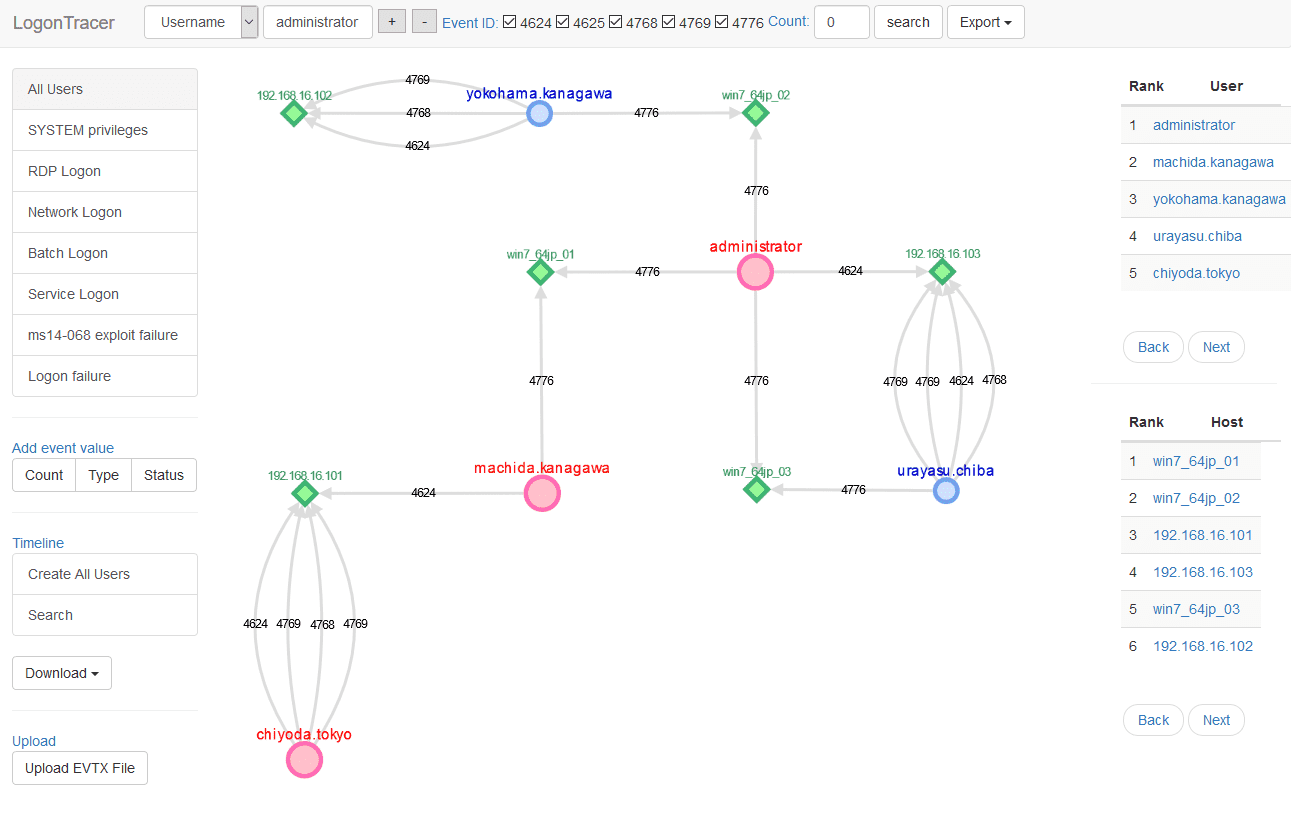
LogonTracer v1.6.1 releases: Investigate malicious Windows logon by visualizing & analyzing Windows event log

LogonTracer
Investigate malicious logon by visualizing and analyzing Windows active directory event logs.
LogonTracer uses PageRank and ChangeFinder to detect malicious hosts and accounts from the event log.
This tool can visualize the following event id related to Windows logon based on this research.
- 4624: Successful logon
- 4625: Logon failure
- 4768: Kerberos Authentication (TGT Request)
- 4769: Kerberos Service Ticket (ST Request)
- 4776: NTLM Authentication
- 4672: Assign special privileges
Changelog v1.6.1
Update
- Updated to display all logs in Timeline graph #130
- Updated bootstrap4-toggle to bootstrap5-toggle
- Updated neo4j-driver 4.4.10 to 4.4.11
- Updated bootstrap 5.0.1 to 5.3.2
- Supported SQLAlchemy 1.4
Bug fix
- Fixed a bug can’t import evtx using pandas 2.0 (issue #135)
- Fixed a bug that docker-compose build error on M1 Mac #131
Install
Requirements
The following tools are used
- Python 3
- Neo4j for a graph database.
- Neo4j JavaScript driver for connects to Neo4j using the binary protocol.
- Cytoscape for visualizing a graph network.
- Flask is a microframework for Python.
Install
- Download and install Neo4j community edition.
- Clone or download LogonTracer.$ git clone https://github.com/JPCERTCC/LogonTracer.git
- Install Neo4j JavaScript driver to static directory.$ cd LogonTracer/static
$ npm install neo4j-driver - Install Python modules.$ pip install -r requirements.txt
If statsmodels installation fails, install numpy first. - Start the Neo4j server.
How to Use
Start LogonTracer with the following command option -r.
Use -h to see help message.
$ python3 logontracer.py -r -o 8080 -u neo4j -p password -s localhost
Access http://[LogonTracer_Server]:8080/ via Web browser.
Import EVTX
Import the event log using Web GUI or logontracer.py.
Use Web GUI
The event log can be imported with upload EVTX button.

Use python script
The event log can be imported by logontracer.py option -e.
$ python3 logontracer.py –e Security.evtx -z +9 -u neo4j -p password -s localhost
Search and visualize the event log
Using the navigation bar to search for account name, hostname, IP address, event id and event count.
The export button can download graph data of CSV, JPG, PNG, and JSON.

Using the side-bar to search for account names matching specific criteria.

- All users: Visualizing all users and hosts.
- SYSTEM privileges: Visualizing users with system privileges.
- RDP Logon: Visualizing RDP logon users and hosts (Logon type: 10).
- Network Logon: Visualizing logon users and hosts from remote network (Logon type: 3).
- Batch Logon: Visualizing batch server logon (Logon type: 4).
- Service Logon: Visualizing Services Control Manager logon (Logon type: 5).
- ms14-068 exploit failure: Visualizing the error log that the ms14-068 exploit failed.
- Logon failure: Visualizing users who failed to log on.
Node details
PageRank
PageRank is an algorithm for checking the importance of web pages.
LogonTracer uses PageRank to examine the importance of accounts and hosts in a domain network.
An account with high PageRank logs on to many hosts and may be used by the attackers’ lateral movement.

Timeline
Timeline button displays hourly event log counts in time series.
Hosts with drastic changes are highlighted.
For anomaly detection using this index, use change point analysis algorithm Change Finder.
For downloading timeline summary and detailed CSV data, click “Download”.

Copyright (C) 2015 JPCERT Coordination Center. All Rights Reserved.
Source: https://github.com/JPCERTCC/


