Loki v2.9.2 releases: horizontally-scalable, highly-available, multi-tenant log aggregation system

Loki: like Prometheus, but for logs.
Loki is a horizontally-scalable, highly-available, multi-tenant log aggregation system inspired by Prometheus. It is designed to be very cost-effective and easy to operate. It does not index the contents of the logs, but rather a set of labels for each log stream.
Compared to other log aggregation systems, Loki:
- does not do full-text indexing on logs. By storing compressed, unstructured logs and only indexing metadata, Loki is simpler to operate and cheaper to run.
- indexes and groups log streams using the same labels you’re already using with Prometheus, enabling you to seamlessly switch between metrics and logs using the same labels that you’re already using with Prometheus.
- is an especially good fit for storing Kubernetes Pod logs. Metadata such as Pod labels is automatically scraped and indexed.
- has native support in Grafana (needs Grafana v6.0).
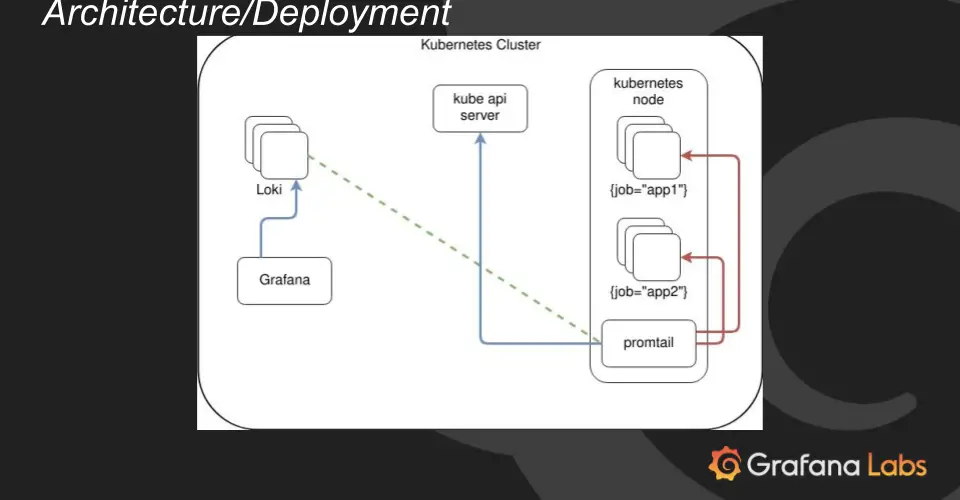
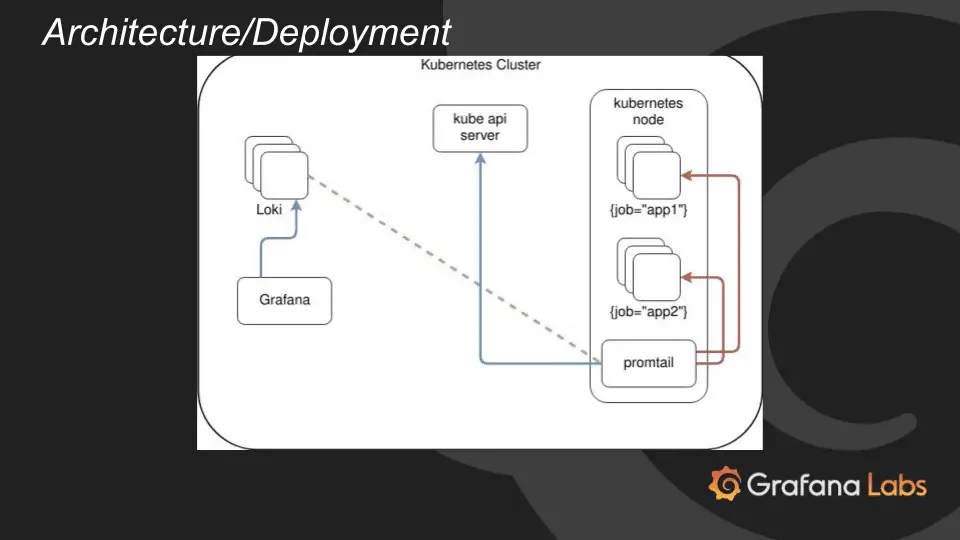
A Loki-based logging stack consists of 3 components:
- promtail is the agent, responsible for gathering logs and sending them to Loki.
- loki is the main server, responsible for storing logs and processing queries.
- Grafana for querying and displaying the logs.
Loki is like Prometheus, but for logs: we prefer a multidimensional label-based approach to indexing and want a single-binary, easy-to-operate system with no dependencies. Loki differs from Prometheus by focussing on logs instead of metrics and delivering logs via push, instead of pull.
Changelog v2.9.2
Notable changes:
Security
- 10879 DylanGuedes: Upgrade golang.org/x/net to v0.17.0 to patch CVE-2023-39325 / CVE-2023-44487
- 10871 ashwanthgoli: Upgrade go to v1.21.3 and grpc-go to v1.56.3 to patch CVE-2023-39325 / CVE-2023-44487
Download && Use
Copyright (C) 2018


