Raven
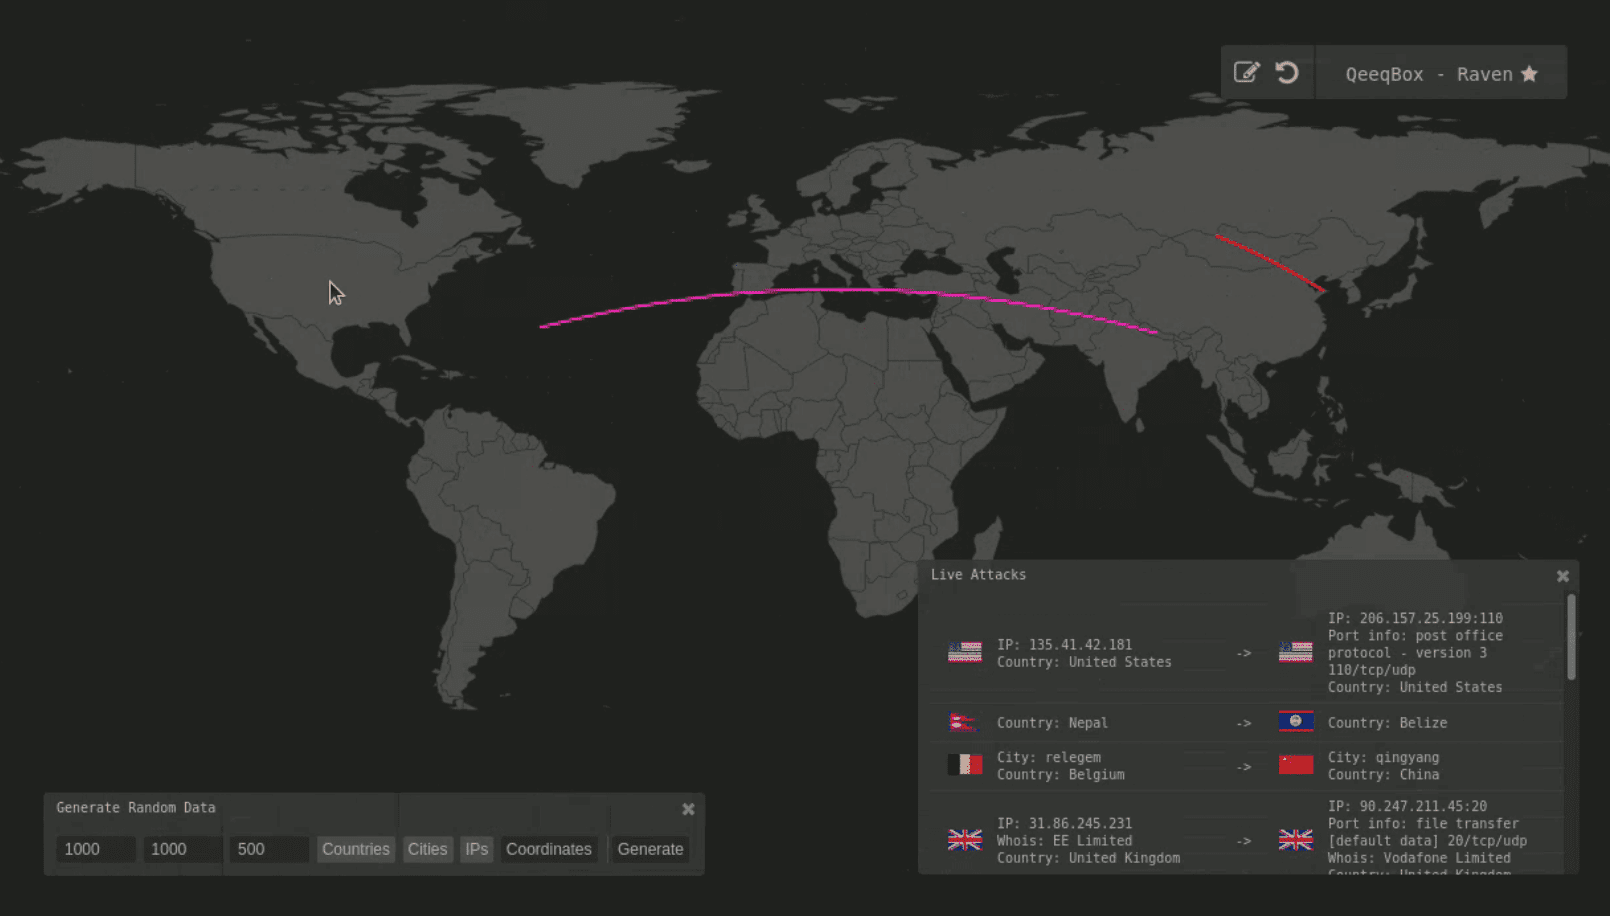
Raven – Advanced Cyber Threat Map (Simplified, customizable and responsive. It uses D3.js with TOPO JSON, has 247 countries, ~100,000 cities, and can be used in an isolated environment without external lookups!.

Features
- Uses D3.js (Not Anime.js)
- Active threat map (Live and replay)
- IP, country, city, and port info for each attack
- Attacks stats for countries (Only known attacks)
- Responsive interface (Move, drag, zoom in and out)
- Customize options for countries and cites
- 247 countries are listed on the interface (Not 174)
- Optimized worldmap for faster rendering
- Includes IP lookup, port information
- Random simulation (IP, country, city)
- Can be used online or offline (Static)
- Theme picker module
Functions
Init the worldmap
qb_raven_map()                      //raven object constructor takes the following:


svg_id                              //SVG ID

world_type                          //round or 2d

selected_countries = []             //List of ISO_3166 alpha 2 countries that will be selected

remove_countries = []               //List of ISO_3166 alpha 2 countries that will be removed from the map

height                              //height of the worldmap

width                               //width of the worldmap

orginal_country_color               //Hex color for all countries

clicked_country_color               //Hex color will be applied to any clickable countries

selected_country_color              //Hex color will be applied to any selected countries

countries_json_location             //Countries JSON file (qcountries.json)

cities_json_location                //Cities JSON file (qcities.json)

global_timeout                      //Global timeout for animation

db_length                           //Size of the db that stores attack events

global_stats_limit                  //Limit attack stats of a country

verbose                             //Verbose output should be off unless (use only for debugging)


raven = new qb_raven_map("#qb-worldmap-svg", null, [], ["aq"], window.innerHeight, window.innerWidth, "#4f4f4f", "#6c4242", "#ff726f", "qcountries.json", "qcities.json", 2000, 100, 10, true)


raven.init_world()                  //Init the worldmap (The worldmap should be ready for you to use at this point)
Plotting data
raven.add_marker_by_name()          //Plot info by country or city name

raven.add_marker_by_ip()            //Plot data by IP address

raven.add_marker_by_coordinates()   //Plot data by coordinates


marker_object                       //An object {'from':'','to':""} see examples

colors_object                       //An object {'line: {'from': ''#FF0000','to': 'FF0000'}} this the color of the line between 2 points - (if null, then a random color will be picked)

timeout                             //Animation time out

marker = []                         //A list of animation marker, use ['line'] for now


raven.add_marker_by_name({'from':'seattle,wa,us','to':'delhi,in'},{'line':{'from':null,'to':null}},2000,['line'])

raven.add_marker_by_ip({'from':'0.0.0.0','to':'0.0.0.0:53'},{'line':{'from':'#FF0000','to':'#FF0000'}},1000,['line')

raven.add_marker_by_coordinates({'from':['-11.074920','-51.648929'],'to':['51.464957','-107.583864']},{'line':{'from':null,'to':'#FFFF00'}},1000,['line'])
Plotting data + adding it to the output table
raven.add_to_data_to_table()        //Plot info and add them to the output table


method                              //Name, IP or coordinates

marker_object                       //An object {'from':'','to':""} see examples

colors_object                       //An object {'line: {'from': ''#FF0000','to': 'FF0000'}} this the color of the line between 2 points - (if null, then a random color will be picked)

timeout                             //Animation time out

marker = []                         //A list of animation marker, use ['line'] for now


raven.add_to_data_to_table('name',{'from':'seattle,wa,us','to':'delhi,in'},{'line':{'from':null,'to':null}},2000,['line'])

raven.add_to_data_to_table('ip',{'from':'0.0.0.0','to':'0.0.0.0:3389'},{'line':{'from':'#FF0000','to':'#FF0000'}},1000,['line')

raven.add_to_data_to_table('coordinates',{'from':['-11.074920','-51.648929'],'to':['51.464957','-107.583864']},{'line':{'from':null,'to':'#FFFF00'}},1000,['line'])
Copyright (C) 2021 qeeqbox


