Sealighter: Easy ETW Tracing for Security Research

Sealighter – Easy ETW Tracing for Security Research
Sealighter leverages the feature-rich Krabs ETW Library to enable detailed filtering and triage of ETW and WPP Providers and Events.
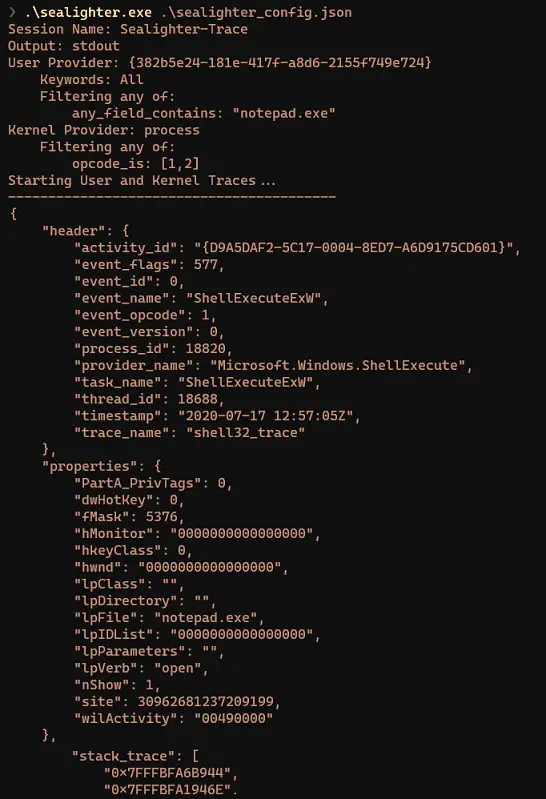
You can subscribe and filter multiple providers, including User mode Providers, Kernel Tracing, and WPP Tracing, and output events as JSON to either stdout, a file, or the Windows Event Log (useful for high-volume traces like FileIO). No knowledge of the events the provider may produce, or their format, is necessary, Sealighter automatically captures and parses any events it is asked.
Events can then be parsed from JSON in Python, PowerShell, or forwarded to Splunk or ELK for further searching.
Filtering can be done on various aspects of an Event, from its ID or Opcode to matching a property value, to doing an arbitrary string search across the entire event (Useful in WPP traces or when you don’t know the event structure but have an idea of its contents). You can also chain multiple filters together, or negate the filter. You can also filter the maximum events per ID, useful to investigate a new provider without being flooded by similar events.
Why this exists
ETW is an incredibly useful system for both Red and Blue teams. Red teams may glean insight into the inner workings of Windows components, and Blue teams might get valuable insight into suspicious activity.
A common research loop would be:
- Identify interesting ETW Providers using logman query providers or Looking for WPP Traces in Binaries
- Start a Session with the interesting providers to enable, and capture events whilst doing something ‘interesting’
- Look over the results, using one or more of:
- Eyeballing each event/grepping for words you expect to see
- Run a script in Python or PowerShell to help filter or find interesting captured events
- Ingesting the data into Splunk or an ELK stack for some advanced UI-driven searching
Doing this with ETW Events can be difficult, without writing code to interact with and parse events from the obtuse ETW API. If you’re not a strong programmer (or don’t want to deal with the API), your only other options are to use a combination of older inbuilt windows tools to write to disk as binary etl files, then dealing with those. WPP traces compounds the issues, providing almost no easy-to-find data about the provider and their events.
Projects like JDU2600’s Event List and ETWExplorer give some static insight, but Providers often contain obfuscated event names like Event(1001), meaning the most interesting data only becomes visible by dynamically running a trace and observing the output.
Features
- Subscribe to multiple ETW and WPP Providers at once
- Automatically parse events into JSON without needing to know the format
- Robust Event filtering including filter chaining and filter negation
- Output to Standard out, File, or Windows Event Log (to be ingested by other tools)
- Get event stack traces
- Configurable Buffering many events in a time period into one with a count, to reduce the number of events generated


