tenet v0.2 releases: Trace Explorer for Reverse Engineers

Tenet – A Trace Explorer for Reverse Engineers
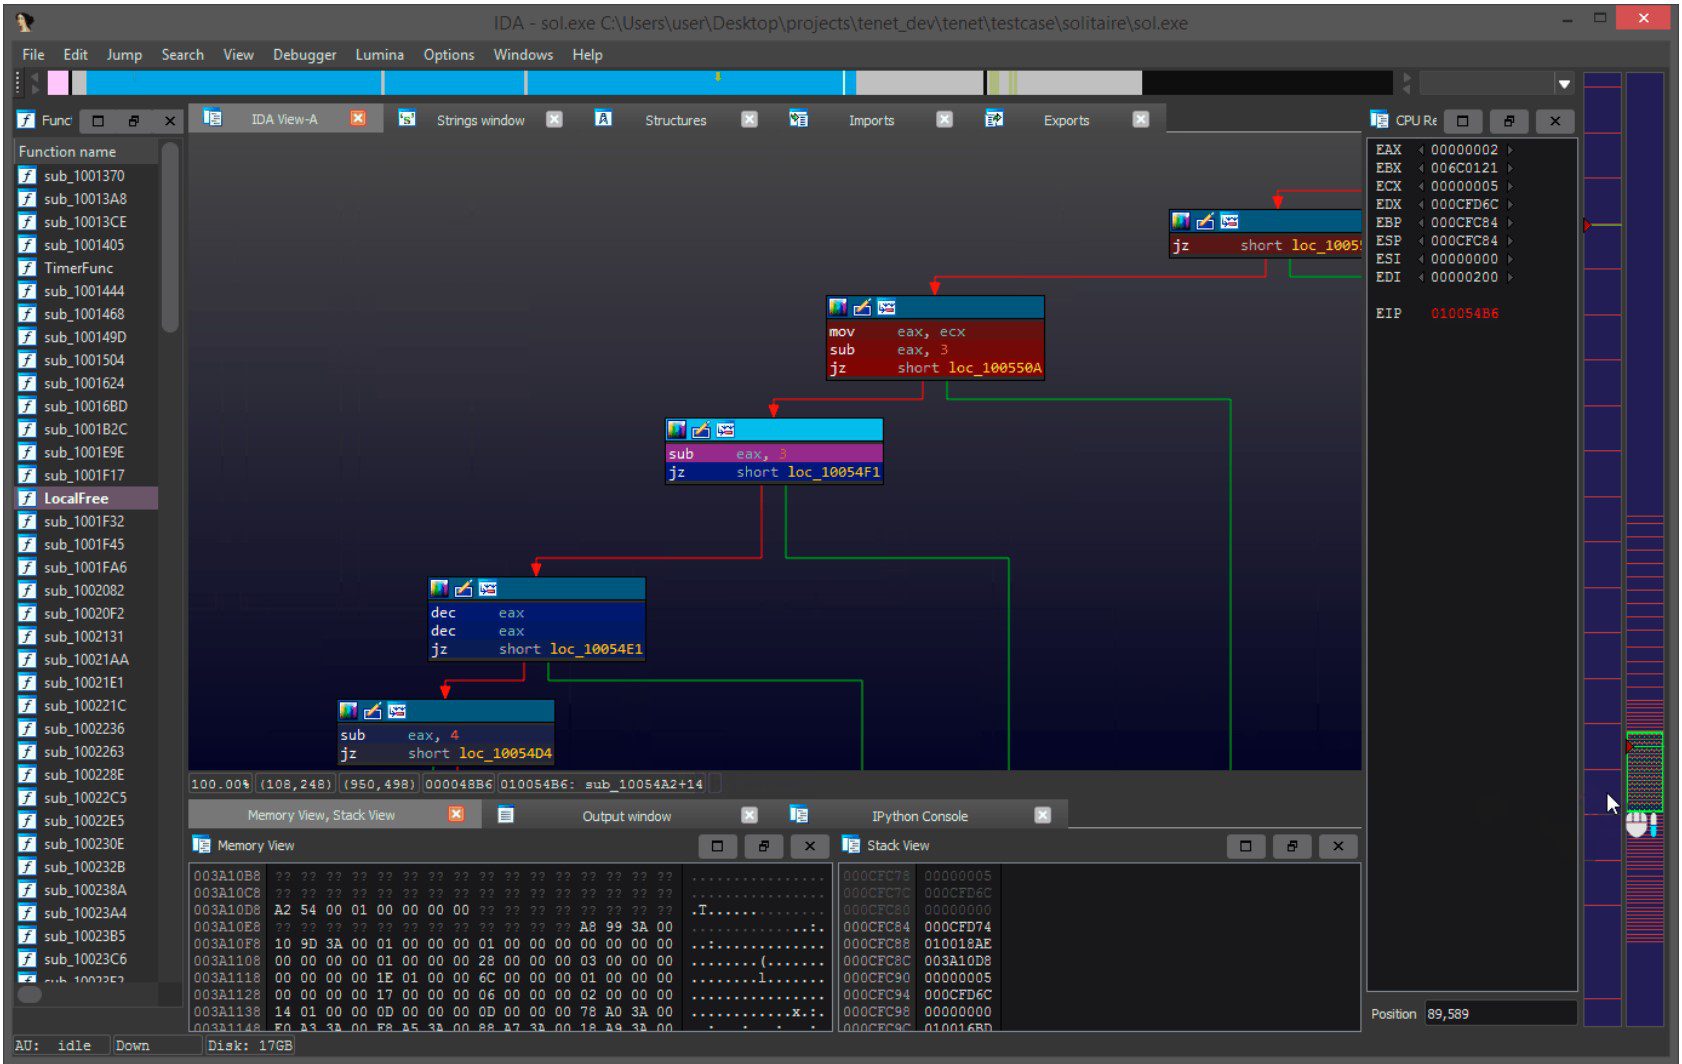
Tenet is an IDA Pro plugin for exploring execution traces. The goal of this plugin is to provide more natural, human controls for navigating execution traces against a given binary. The basis of this work stems from the desire to research new or innovative methods to examine and distill complex execution patterns in software.
For more context about this project, please read the blogpost about its initial release.
FAQ
Q: How do I record an execution trace using Tenet?
- A: Tenet is a trace reader, not a trace recorder. You will have to use dynamic binary instrumentation frameworks (or other related technologies) to generate a compatible execution trace. Please refer to the tracing readme for more information on existing tracers, or how to implement your own.
Q: What trace architectures does Tenet support loading?
- A: Only x86 and AMD64, but the codebase is almost entirely architecture agnostic.
Q: How big of a trace file can Tenet load / navigate?
- A: Tenet’s trace reader is pure python, it was written as an MVP. There is no guarantee that traces which exceed 10 million instructions will be reasonable to navigate until a native backend replaces it.
Q: I loaded an execution trace, now there is a ‘.tt’ file. What is it?
- A: When Tenet loads a given text trace, it will parse, index, and compress the trace into a more performant format. On subsequent loads, Tenet will attempt to load the ‘.tt’ file which should load in a fraction of the time that it would take to load the original text trace.
Q: The plugin crashed/threw an error / is showing bad trace information, what should I do?
- A: If you encounter an issue or inaccuracy that can be reproduced, please file an issue against this repository and upload a sample trace + executable.
Q: Memory in my trace is changing, but there are no writes to the region. Is this a bug!?
- A: Your log file may not have captured all memory writes. For example, usermode DBI generally do not get a memory callback for external writes to process memory. This is most common when reading from a file, or from socket — it is the kernel that writes memory into your designated usermode buffer, making the event invisible to traditional instrumentation.
- Microsoft TTD generally exhibits the same behavior, it’s tricky to solve without modeling syscalls.
Q: Will this be ported to Binary Ninja / Ghidra / …?
- A: Possibly, but not anytime soon (unless there is a significant incentive). As a research-oriented project, the driving motivation is on developing novel strategies to organize and explore program execution — not porting them.
Q: My organization would like to support this project, how can we help?
- A: Without funding, the time I can devote to this project is limited. If your organization is excited by the ideas put forth here and capable of providing capital to sponsor dedicated R&D, please contact us.
Changelog v0.2
+ Features
|- Overhauled Tenet’s breakpoint / selection / navigation model to be more explicit
|- Tenet will now attempt to automatically resolve ASLR mappings with basic trace analysis
|- Added a cell-based drawing mode that is used when zoomed in far enough on the tracebars
|- Added !last command to the ‘timestamp shell’ to jump to the last ‘navigable’ trace address
|- What The Fuzz (https://github.com/0vercl0k/wtf) added native support for Tenet traces
+ Minor Changes
|- Tracebars now draw ‘un-navigable’ regions of the trace grey (such as library/external calls)
|- Tenet will now stay on the last ‘navigable’ mapped address when stepping through unmapped regions
|- Improved the selection behavior and interaction with ‘zooming’ on tracebars
|- Improved the selection behavior in the memory dump view (stack still needs work…)
|- Both ‘code’ and ‘memory’ breakpoints can be active at the same time now, not just one
|- Added more fine-grained right-click controls for interacting with ‘region’ breakpoints
|- Added various right-click ‘Clear … breakpoints’ to the mem, trace, and reg views
|- Highlighting and double clicking a region of memory will now set a region access breakpoint
|- Double clicking ’empty’ space in the mem / reg views can be used to automatically clear breakpoints
|- Updated theme subsystem and colors a little bit to be more consistent
|- A little bit of code and comment cleanup, but not a lot
+ Bugfixes
|- Tenet now ensures a selected text trace will be parsed if a packed trace does not actually match it
|- A bug could cause Tenet to show wrong register values towards the end of a trace segment
|- Step-over / reverse step-over could fail near the start/end of the trace
|- Fixed a bug that could cause the sample pin tracer to crash from uninitialized memory
|- mrexodia fixed a bug that could cause the pin tracer to crash on the fxsave instruction
|- Fixed / eliminated several misc UI / selection bugs through simple refactoring
Download & Use
Copyright (c) 2021 Markus Gaasedelen


