tsharkVM: tshark + ELK analytics virtual machine

tshark ELK VM appliance
tshark can be used in this way as a monitoring probe to push the data into Elasticsearch cluster which enables:
-
Indexing of the selected protocol data
-
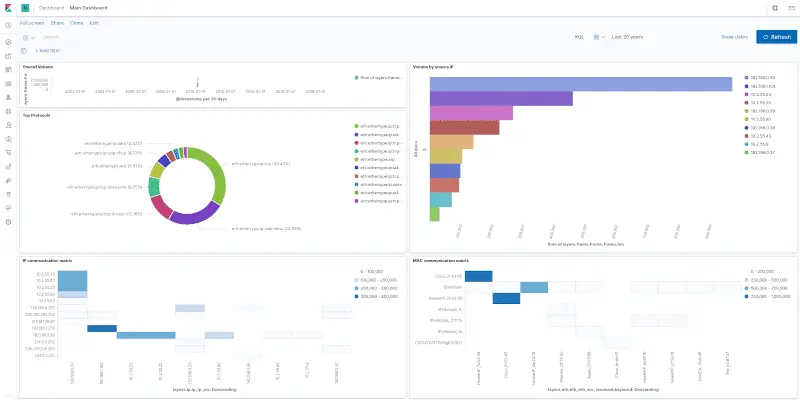
Security dashboards in Kibana
-
Free monitoring tool for example for Telecom Operators, SCADA, and industry networks (for all protocols which Wireshark support)
-
Possible further analytic and correlating scripts working on top on Elasticsearch
Possible architecture:
-
Multiple tshark probes generating json for Elasticsearch
-
Collector downloading over SCP or sFTP the files from tshark probes or directly using HTTP to push data into Elasticsearch
-
Collector pushing data into Elasticsearch cluster
tsharkVM builds a virtual machine which can be used for analytics of tshark -T ek (ndjson) output. The virtual appliance is built using vagrant, which builds Debian 10 with a pre-installed and pre-configured ELK stack.
After the VM is up, the process is simple:
- decoded pcaps (tshark -T ek output / ndjson) are sent over TCP/17570 to the VM
- ELK stack in VM will process and index the data
- Kibana is running in VM and can be accessed on http://127.0.0.1:15601/app/kibana#/dashboards
Install & Use
Copyright (C) 2021 H21lab


