varc (Volatile Artifact Collector)
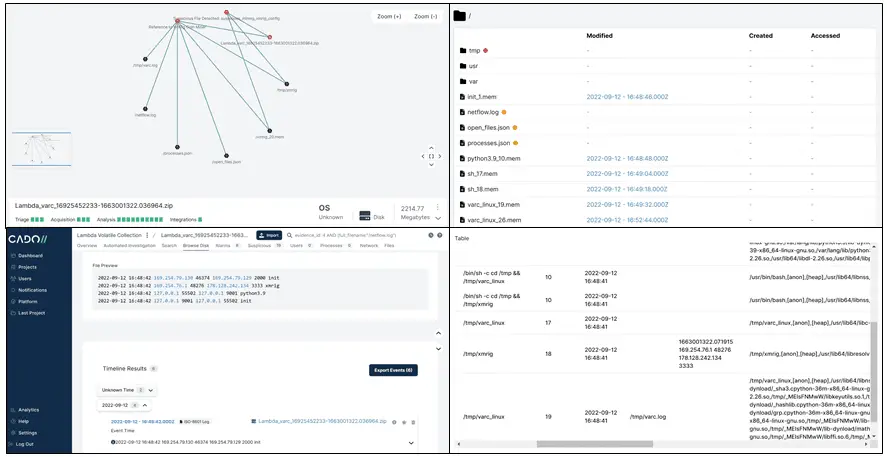
varc collects a snapshot of volatile data from a system. It tells you what is happening on a system, and is of particular use when investigating a security incident.
It creates a zip, which contains a number of different pieces of data to understand what is happening on a system:
- JSON files e.g. running processes and what network connections they are making
- Memory of running processes, on a per-process basis. This is also carved to extract log and text data from memory
- Netstat data of active connections
- The contents of open files, for example, running binaries
We have successfully executed it across:
- Windows
- Linux
- OSX
- Cloud environments such as AWS EC2
- Containerised Docker/Kubernetes environments such as AWS ECS/EKS/Fargate and Azure AKS
- Even serverless environments such as AWS Lambda
Automated Investigations and Response
varc significantly simplifies the acquisition and analysis of volatile data. Whilst it can be used manually on an ad-hoc basis, it is a great match for automatic deployment in response to security detections. The output of varc is designed to be easily consumed by other tools, in standard JSON format as much as possible.
A typical pipeline might be:
- A detection is fired from a detection tool
- varc is deployed to collect and identify further activity
- Further remediation actions are taken based on the analysis of varc output
Why are the collected memory files empty?
Process memory collection is not currently supported on OSX.
If you run varc on a Linux system without the Ptrace Kernel capability enabled, you will get empty memory files. You will still get detailed system output.
For example, in our testing:
- AWS Lambda successfully dumped process memory by default.
- EKS on EC2 successfully dumped process memory by default.
- ECS on Fargate required us to enable CAP_SYS_PTRACE in our task definition.
Install & Use
Copyright (C)2023 cado-security