vnstat v2.11 releases: a network traffic monitor for Linux and BSD

vnStat
vnStat is a console-based network traffic monitor that uses the network interface statistics provided by the kernel as the information source. This means that vnStat won’t actually be sniffing any traffic and also ensures light use of system resources.
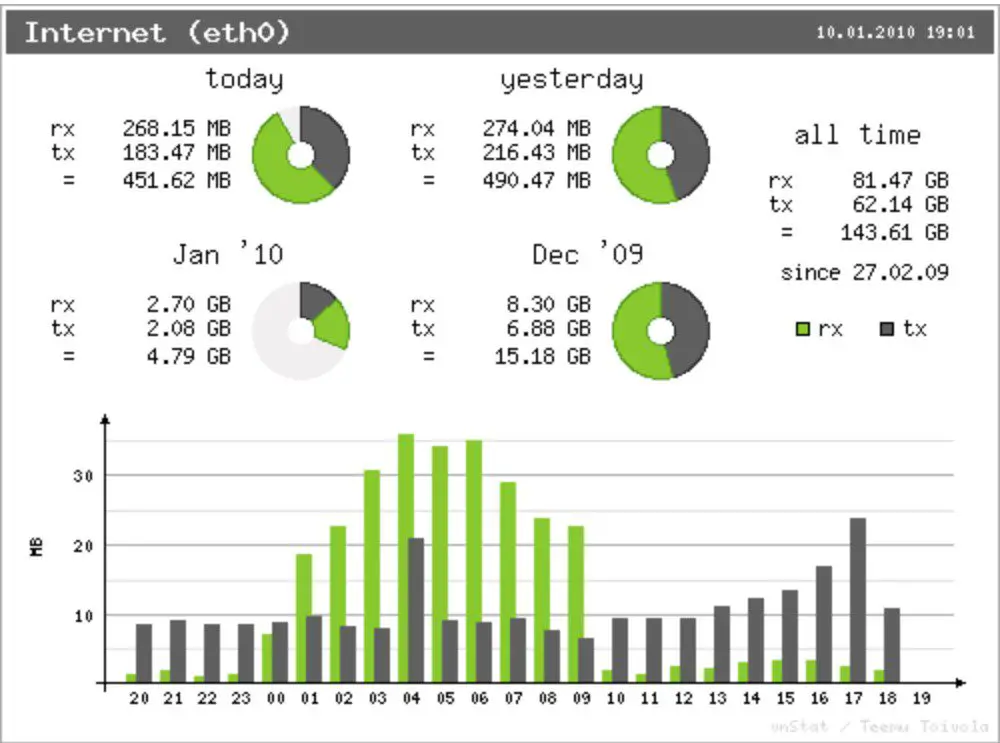
By default, traffic statistics are stored on a five-minute level for the last 48 hours, on an hourly level for the last 4 days, on a daily level for the last 2 full months, and on a yearly level forever. The data retention durations are fully user-configurable. Total seen traffic and a top days listing are also provided. Optional png image output is available in systems with the gd library installed.

Feature
- quick and simple to install and get running
- gathered statistics persist through system reboots
- can monitor multiple interfaces at the same time
- several output options
- summary, 5 minutes, hourly, daily, monthly, weekly, yearly, top days
- optional png image output (using libgd)
- data retention duration is fully user configurable on the fly
- months can be configured to follow the billing period
- light, minimal resource usage
- same low cpu usage regardless of traffic
- can be used without root permissions
- online color configuration editor
Changelog v2.11
- Fixed
- Database queries worked only if SQLite double-quoted string (DQS)
feature (https://www.sqlite.org/quirks.html#dblquote) was enabled - Disabling data resolutions in data retention configuration didn’t result
in possibly existing database entries getting removed from the database - Disabling data resolutions in data retention configuration didn’t result
in the data resolution getting disabled but instead storing data forever expr: syntax errorduring configure in BSD (pull request by namtsui)- Image output summary would show only “no data available” text in case of
zero total traffic even when the historical data of no traffic could have
been shown instead - Image output
-o -content could get corrupted due to info, warning and
error messages also using stdout, configuration file warnings being the
most likely source, now uses stderr in image output - Configuration validation was too heavily limiting and enforcing image
output 5 minute graph related configuration options for combinations that
would have resulted in usable images
- Database queries worked only if SQLite double-quoted string (DQS)
- New
- Database cleanup has been changed to interpret data retention
configuration as number of entries to be kept instead of calendar time,
this restores the behaviour to similar as it was up to version 1.18, the
difference is visible only on systems that aren’t powered all the time - Database is vacuumed during daemon startup and reload, behaviour is
configurable usingVacuumOnStartupandVacuumOnHUPSignalconfiguration
options - Add configuration option
InterfaceOrderfor controlling the interface
order in outputs with multiple interfaces - Used data retention configuration is made visible during daemon startup
and after configuration reloads - Daemon will no longer start if all data resolutions have been disabled
in the configuration file - SQLite version is visible in
--versionoutputs
- Database cleanup has been changed to interpret data retention
- Notes
Not enough data available yet.message has been replaced with
No data. Timestamp of last update is same YYYY-MM-DD HH:MM:SS as of database creation.
to better explain the reason why there’s nothing to show, this message
is expected to disappear within configuredSaveIntervalif the interface is active
Copyright (C) 2017 vergoh


