A-Detector: An anomaly-based intrusion detection system

A-Detector
A-Detector is a software developed to automate the analysis of network anomalies in large dataframes. Thanks to a series of algorithms, A-Detector can detect anomalous data and display it in dynamic graphics.
How it works
A-Detector imports network traffic, and based on a series of algorithms like; Variable Scaling and Isolation Forest, is able to normalize data and detect anomalies in the dataframe.
Data import
This is the first step to start playing.
import pandas as pd
import numpy as npdf = pd.read_json(‘/home/alexfrancow/netflow.json’)
Data group
At this point, we basically tell the application to count the packets that have the same IP and the same protocol in a time period of 5 seconds.
If we have the next table:
With the data group, the output will be as follows:
Data normalization
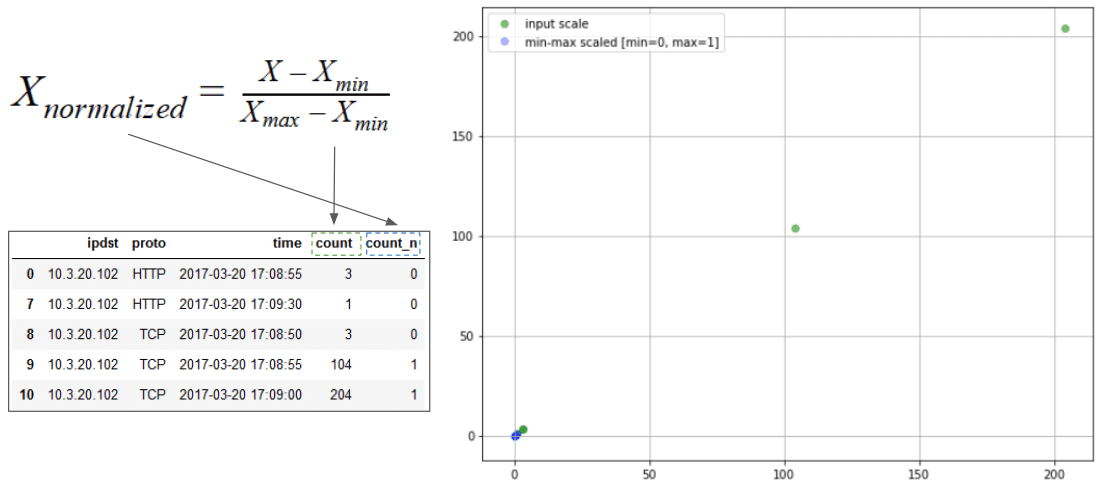
An approach to Z-score normalization (or standardization) is the so-called Min-Max scaling. In this approach, the data is scaled to a fixed range – usually 0 to 1.

Apply the Isolation Forest algorithm
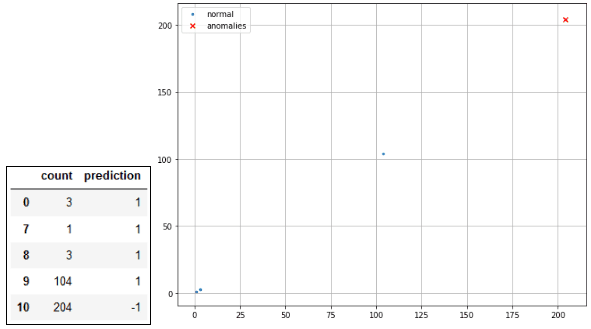
The IsolationForest ‘isolates’ observations by randomly selecting a feature and then randomly selecting a split value between the maximum and minimum values of the selected feature.

Visualize the anomalies
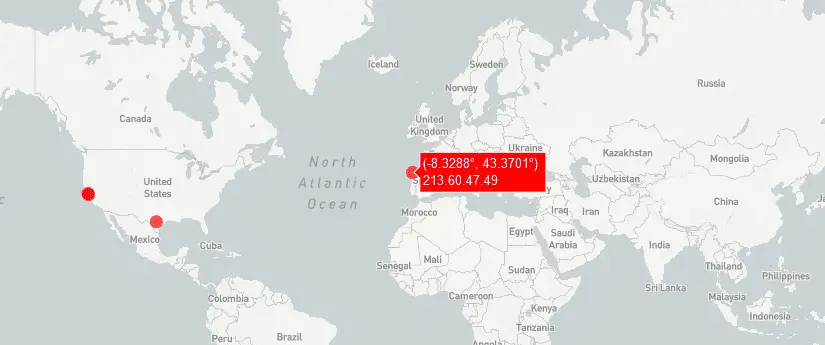
The results of all these algorithms will be printed on a map, to offer a good view to the user.


