PcapViz: Visualize network topologies & collect graph statistics based on pcap files
PcapViz
PcapViz visualizes network topologies and provides graph statistics based on pcap files. It should be possible to determine key topological nodes or data exfiltration attempts more easily.
Features
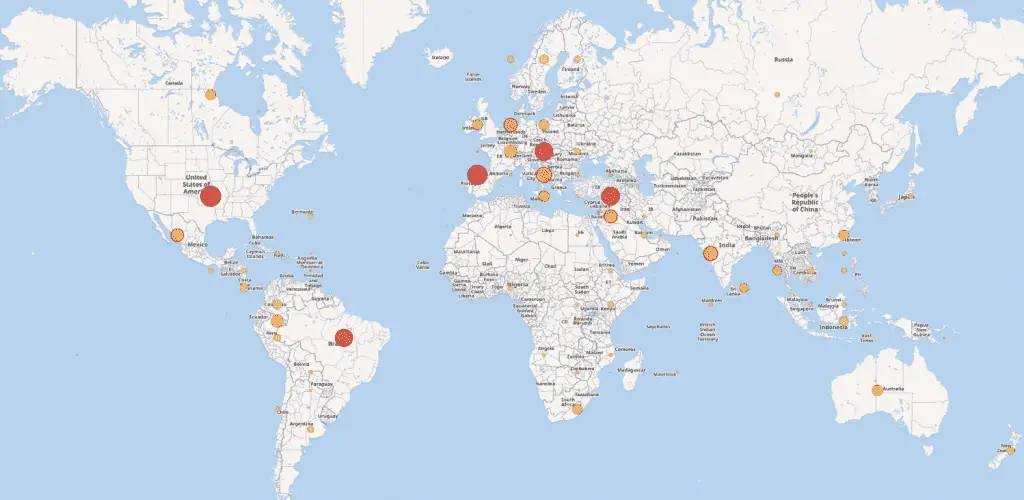
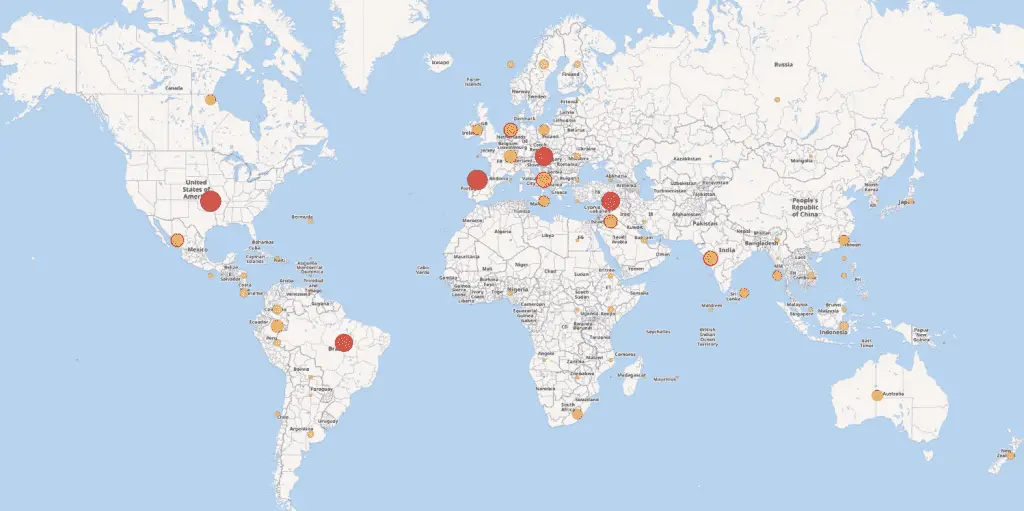
- Draw network topologies (Layer 2) and communication graphs (Layer 3 and 4)
- Network topologies contain country information and connection stats
- Collect statistics such as most frequently contacted machines
Installation
Required:
- GraphViz
- Download GeoIP database to ~/GeoIP.dat (https://dev.maxmind.com/geoip/)
Usage
Example
Example pcap: smallFlows.pcap
Drawing a communication graph (layer 2), segment:
python main.py -i smallFlows.pcap -o small_tcp_l2.png –layer2
Drawing a communication graph (layer 3), segment:
python main.py -i smallFlows.pcap -o small_tcp.png –layer3
Drawing a communication graph (layer 4), segment:
python main.py -i smallFlows.pcap -o small_tcp_l4.png –layer4
Return most frequently contacted hosts:
python main.py -i smallFlows.pcap –layer3 –frequent-in
115 172.16.255.1
70 192.168.3.131
21 10.0.2.15
2 65.55.15.244
2 224.0.0.252
2 192.168.3.90
2 239.255.255.250
2 255.255.255.255
1 178.144.253.171
1 92.247.222.20
1 72.14.213.103
1 67.170.187.174
…
Source: https://github.com/mateuszk87/