Pentest Lab
This local pentest lab leverages docker-compose to spin up multiple victim services and an attacker service running Kali Linux. If you run this lab for the first time it will take some time to download all the different docker images.
Services
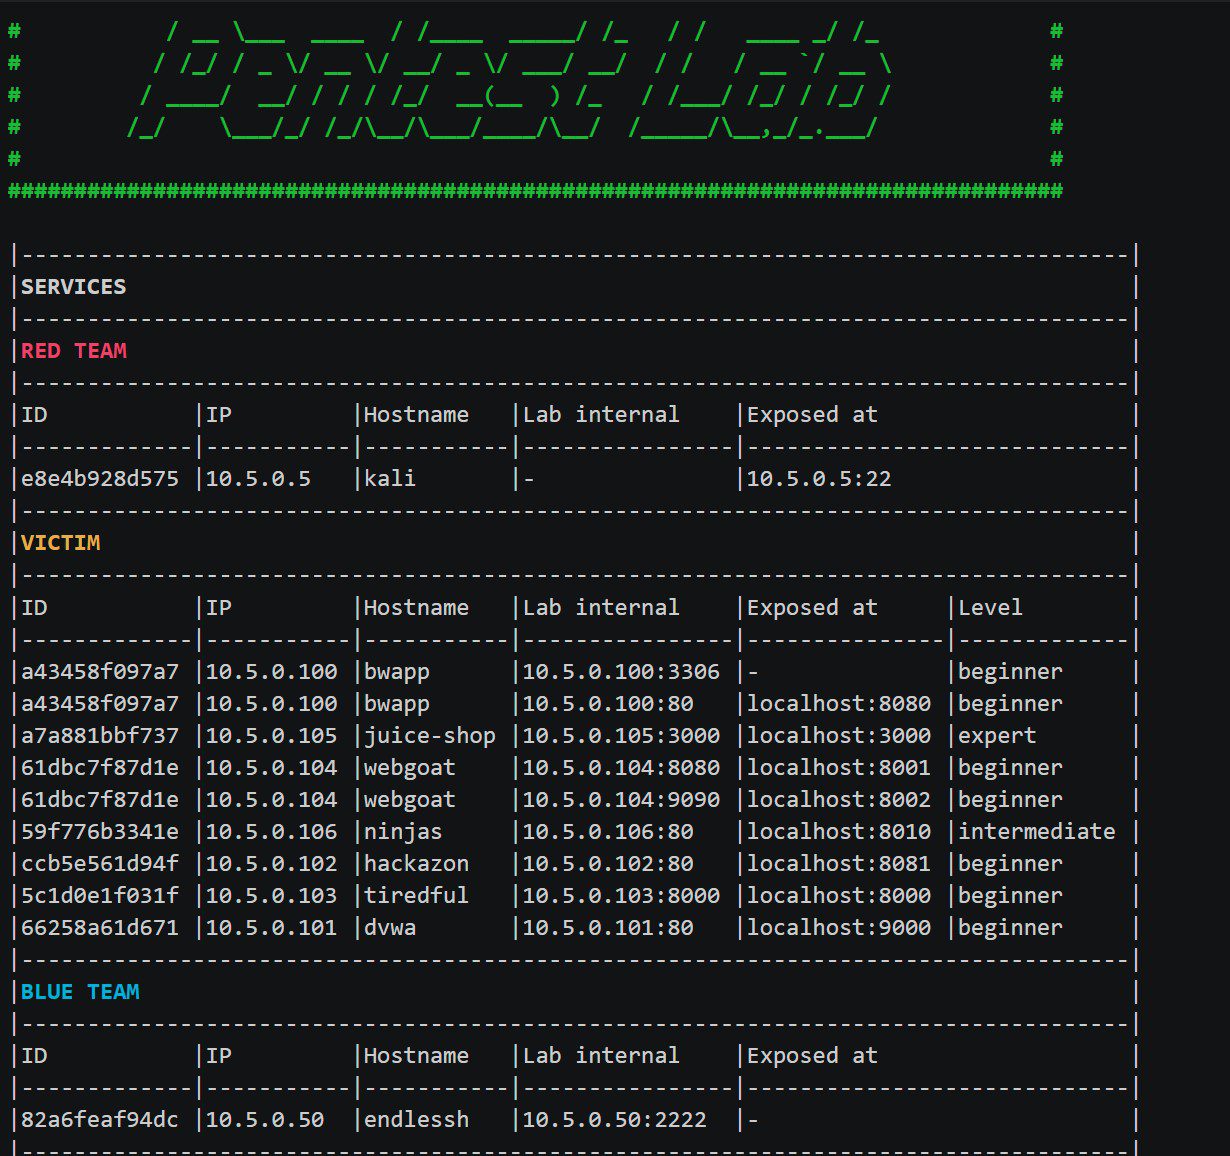
This lab knows the following four types of services.
- red_team
- blue_team
- victim
- monitoring
The default red team service – the Kali service – is a pretty basic Kali instance. Nonetheless, kali-tools-web metapackage is installed. For a web application testing lab, the basic web testing tools seem to be useful. This can be changed by editing the Dockerfile from which the image is built. This is located at ./dockerfiles/kali. The kali service installs these dotfiles by default. This is also changeable by tweaking the Dockerfile.
Victim services
- juice-shop
- hackazon
- tiredful-api
- WebGoat
- bwapp
- DVWA
- XVWA
- ninjas
Monitoring services
Even though monitoring services are blue_team services as well these are split up into different category.
This stack provides log and performance observation functionality.
For further information on single instances see below.
Currently, the monitoring setup is made of the following services:
- Grafana – Visualize logs and metrics.
- Loki – Ship docker logs to grafana.
- Prometheus – Ship metrics to grafana.
- cAdvisor – Gather container resource usage and metrics and ship to prometheus.
Grafana
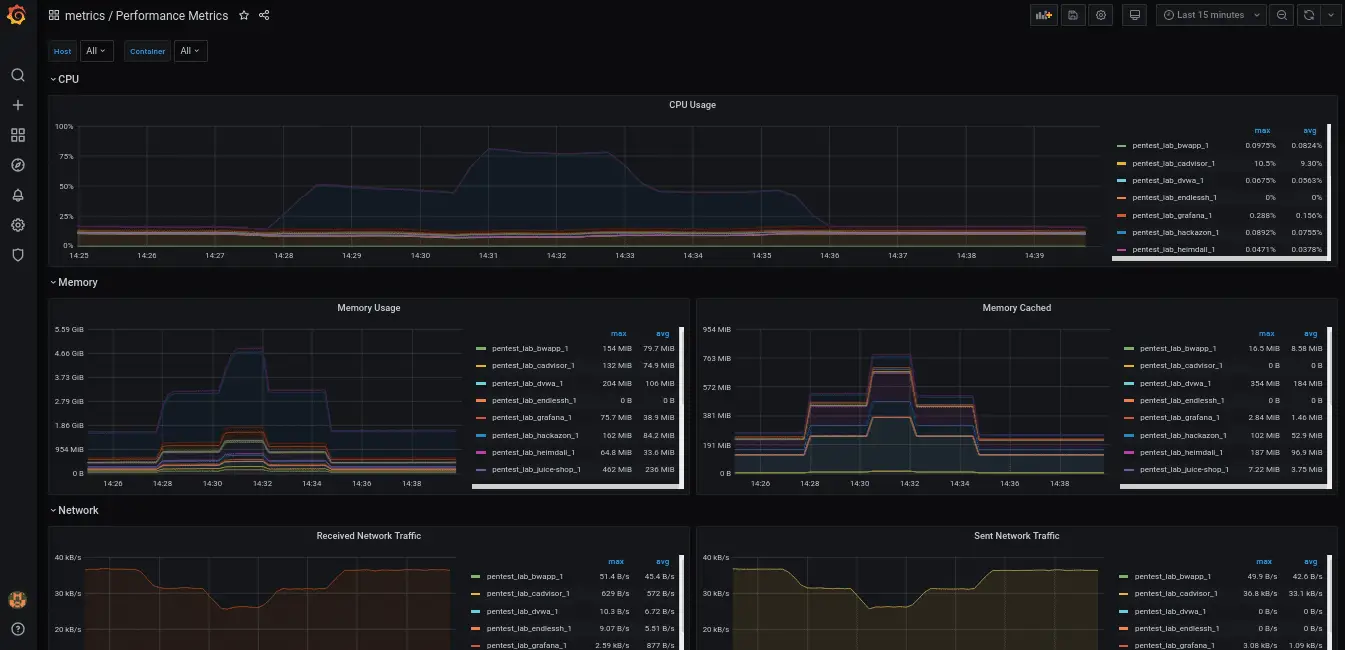
The Grafana instance provides two dashboards one for logs and one for metrics.
These are pretty basic. One could add more by adding dashboards via the Grafana interface. These dashboards will be lost when the grafana volume is deleted. To permanently add dashboards consult the Provisioning Docs by Grafana. Used directories for provisioning are located at ./etc/grafana/.
To change settings via the Grafana interface one must login as admin. The credentials are the default ones: admin:admin. #hacktheplanet
Loki
For Loki to be able to gather docker logs, this lab installs the Loki Docker Driver as a Docker plugin.
Prometheus / cAdvisor
For Prometheus being able to access performance metrics of the containers running in the cluster cAdvisor is used.
Install
Copyright (C) 2020 oliverwiegers
