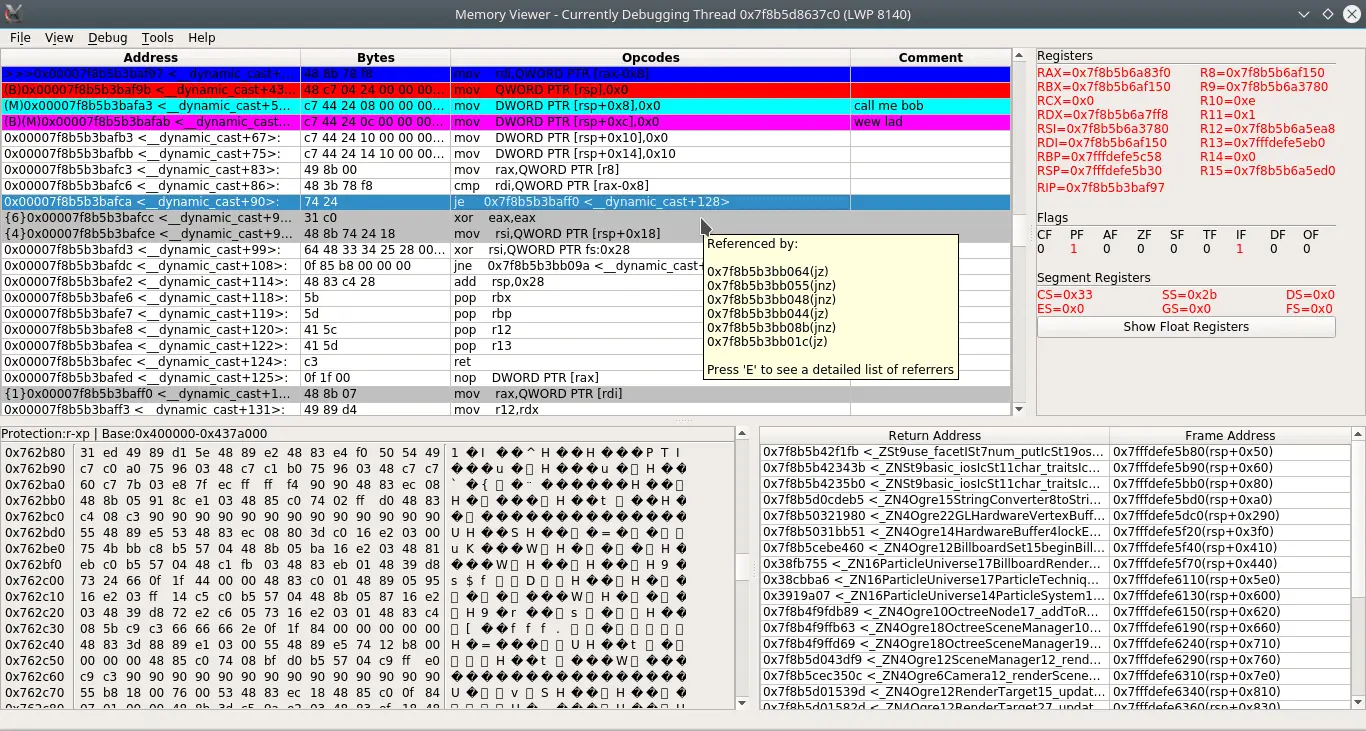
PINCE
PINCE is a front-end/reverse engineering tool for the GNU Project Debugger (GDB), focused on games. However, it can be used for any reverse-engineering related stuff. PINCE is an abbreviation for “PINCE is not Cheat Engine”.

Features
- Memory searching [Planned] (The plan is to use libscanmem by wrapping it with a gdb python script)
- Variable Inspection&Modification [Done/Basic]
- CheatEngine-like value type support: Byte to 8 Bytes, Float, Double, Strings(including utf-8, utf-16, utf-32 and zero-terminate strings), Array of Bytes [Done]
- Symbol Recognition: See here [Done]
- Automatic Variable Allocation: See here [Done]
- Dynamic Address Table: Supports drag&drop, recursive copy&pasting&inserting and many more [Done]
- Manual Address Table Update: [Done]
- Smart casting: PINCE lets you modify multiple different-type values together as long as the input is parsable. All parsing/memory errors are directed to the terminal [Done]
- Continuous Address Table Update: You can adjust update timer or cancel updating by modifying settings. Non-stop version is Postponed\Quarterway Done [Done\Only works when the inferior is stopped]
- Variable Locking: PINCE lets you freeze(constantly write a value to memory cell) variables [Postponed\Quarterway Done]
- Postpone reason: These two features requires thread injection to the target or gdb and PINCE’s injection methods are not perfect yet, I’ve already spent more(read:WAY MORE) time than I should on this, these features are not vital for now, also you have got the options to manually update the table and set the value manually already
- Memory View [Done/Basic]
- Infinite Scrolling: PINCE automatically disassembles the next available instruction(s) on mouse wheel/scrollbar move. Instruction count can be changed from settings. Hex View also supports this feature [Done]
- Dissect Code: You can dissect desired memory regions to find referenced calls, jumps and strings. Disassemble screen will automatically handle the referenced data and show you if there’s a referenced address in the current dissasemble view. It can be used from Tools->Dissect Code in the MemoryView window. Using its hotkey instead in the MemoryView window automatically dissects the currently viewed region. You can separately view referenced calls and strings after the search from View->Referenced Calls/Strings. Note: If you decide to uncheck ‘Discard invalid strings’ before the search, PINCE will try to search for regular pointers as well [Done]
- Bookmarking: Bookmark menu is dynamically created when right clicked in the disassemble screen. So unlike Cheat Engine, PINCE lets you set unlimited number of bookmarks. List of bookmarks can also be viewed from View->Bookmarks in the MemoryView window. Commenting on an address automatically bookmarks it. [Done]
- Modify on the fly: PINCE lets you modify registers on the fly. Unlike CE, you can also change XMM and FPU registers. Check GDB expressions in the Wiki page for additional information [Done]
- Opcode Search: You can search opcodes with python regular expressions. To use this feature, click Tools->Search Opcode in the MemoryView window. [Done]
- Debugging [Done/Basic]
- Has basic debugging features such as stepping, stepping over, execute till return, break, continue. Also has breakpoints, watchpoints and breakpoint conditions. Has advanced debugging utilities such as Watchpoint/Breakpoint Tracking and Tracing
- Chained Breakpoints: Just like CE, PINCE allows you to set multiple, connected breakpoints at once. If an event(such as condition modification or deletion) happens in one of the breakpoints, other connected breakpoints will get affected as well [Done]
- Watchpoint Tracking: Allows you to see which instructions have been accessing to the specified address, just like “What accesses/writes to this address” feature in CE [Done]
- Breakpoint Tracking: Allows you to track down addresses calculated by the given register expressions at the specified instruction, just like “Find out what addresses this instruction accesses” feature in CE with a little addon, you can enter multiple register expressions, this allows you to check the value of “esi” even if the instruction is something irrelevant like “mov [eax],edx” [Done]
- Tracing: Almost the same with CE. But unlike CE, you can stop tracing whenever you want. Created from scratch with shittons of custom features instead of using gdb’s trace&collect commands because some people have too much time on their hands [Done]
- Collision Detection: GDB normally permits setting unlimited watchpoints next to each other. But this behaviour leads to unexpected outcomes such as causing GDB or the inferior become completely inoperable. GDB also doesn’t care about the number(max 4) or the size(x86->max 4, x64->max 8) of hardware breakpoints. Fortunately, PINCE checks for these problems whenever you set a new breakpoint and detects them before they happen and then inhibits them in a smart way. Lets say you want to set a breakpoint in the size of 32 bytes. But the maximum size for a breakpoint is 8! So, PINCE creates 4 different breakpoints with the size of 8 bytes and then chains them for future actions [Done]
- Code Injection [Working on it]
- Run-time injection: Only .so injection is supported for now. In Memory View window, click Tools->Inject .so file to select the .so file. An example for creating .so file can be found in “libPINCE/Injection/”. PINCE will be able to inject single line instructions or code caves in near future [Partially Done?]
- GDB Console [Done]
- Is the power of PINCE not enough for you? Then you can use the gdb console provided by PINCE, it’s on the top right in main window
- Simplified/Optimized gdb command alternatives [Working on it]
- Custom scripts instead of using gdb’s x command for reading memory [Done]
- Custom scripts instead of using gdb’s set command for modifying memory [Done]
- libPINCE- A reusable python library
- PINCE provides a reusable python library. You can either read the code or check Reference Widget by clicking Help->libPINCE in Memory Viewer window to see docstrings. Contents of this widget is automatically generated by looking at the docstrings of the source files. PINCE has a unique parsing technique that allows parsing variables. Check the function get_comments_of_variables in SysUtils for the details. This feature might be replaced with Sphinx in the future
- Extendable with .so files at runtime
- See here
- Automatic Trainer Generation: [Planned]
- PINCE provides a trainer auto-generated from current address table on demand by using libPINCE and PyQT5 together
Download && Tutorial
Copyright (C) 2016-2018 Korcan Karaokçu <korcankaraokcu@gmail.com>
Copyright (C) 2016-2018 Çağrı Ulaş <cagriulas@gmail.com>
Copyright (C) 2016-2018 Jakob Kreuze <jakob@memeware.net>
Copyright (C) 2018 user202729
Copyright (C) Mark James 2005, 2006 Silk Icons