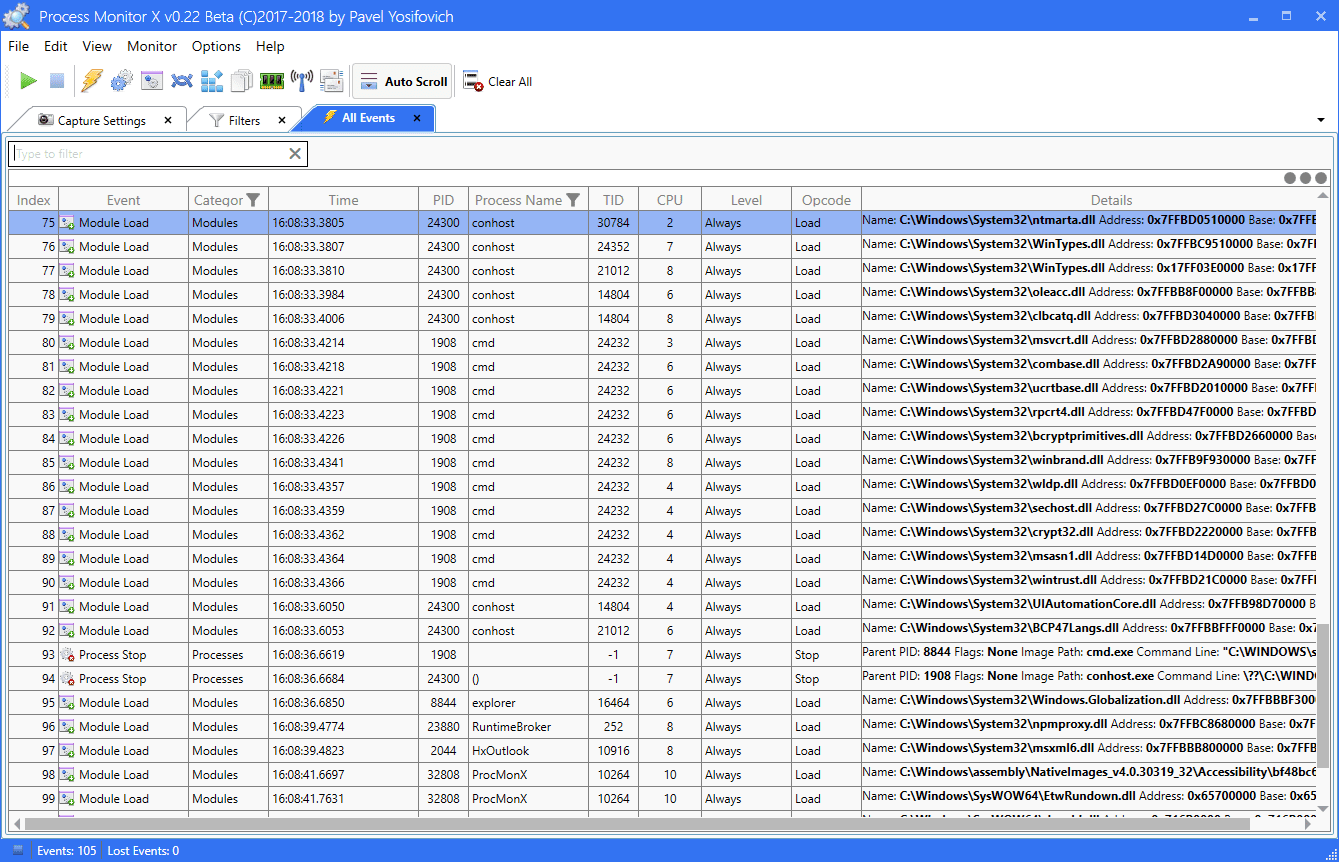
ProcMonX
Extended Process Monitor-like tool based on Event Tracing for Windows
The classic Sysinternals tool Process Monitor uses a file system mini-filter, registry mini-filter, and process/thread callbacks to get the information it provides.
An alternative way is to use Event Tracing for Windows (ETW) to get this information, without the need for a kernel driver. (Process Monitor does use ETW for network events). ProcMonX provides information on similar activities to ProcMon but adds many more events, such as networking, ALPC, and memory.
ProcMonX, on the other hand, uses Event Tracing for Windows (ETW), a diagnostics and logging mechanism that existed since Windows 2000. In ETW, providers spit out events that ETW consumers consume. These events can be logged to a file (.ETL extension) and then analyzed, or alternatively logged in real-time to listening to consumers.
Windows provides many providers out of the box, each exposing a rich set of events. To get a sense of the number of providers to use logman query providers in a command window.
ProcMonX creates a real-time session (no automatic logging to file) and registers for the events the user requests (the current list is small, more events will follow in subsequent versions). The event data is displayed as they come in. All this means is that ProcMonX sacrifices some accuracy and in some cases pieces of information to get in exchange a huge arrange of events that could not be possible with ProcMon.
Copyright (c) 2019 Pavel Yosifovich