Vol3xp, Volatility 3 Explorer Plugins
RAMMap -> Physical Address Mapping (pfn.py)
RAMMap (very similar to Rammap [SysInternals]), but additionally it marks any suspicious pages (for more information read the pdf). This module contains 3 plugins:
- P2V – Converts physical address to virtual address using PfnDatabase and finds the owning process of a page (if any).
- PFNInfo – Gives information about a physical page from the PfnDatabase, the use of the page, file name, and much more.
- RAMMap – Uses both of the plugins above. Displays a RamMap-like UI for all the physical pages, and colors suspicious pages. [You can see far more detailed information about the plugins in the pdf]
And the main event -> Volatility Explorer (volexp.py)
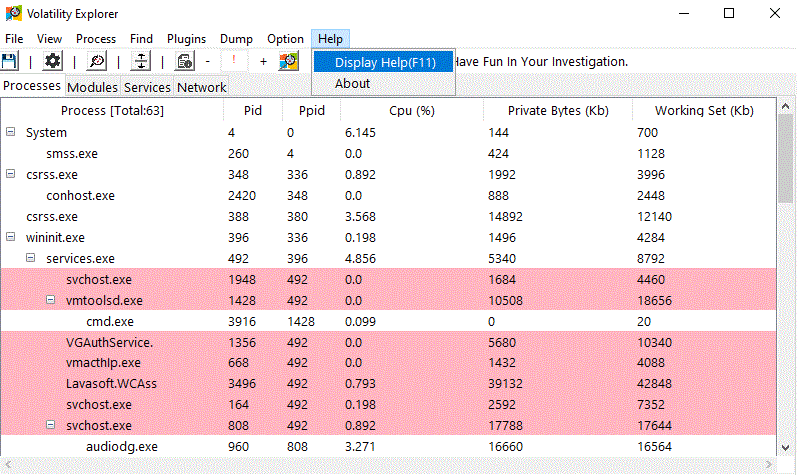
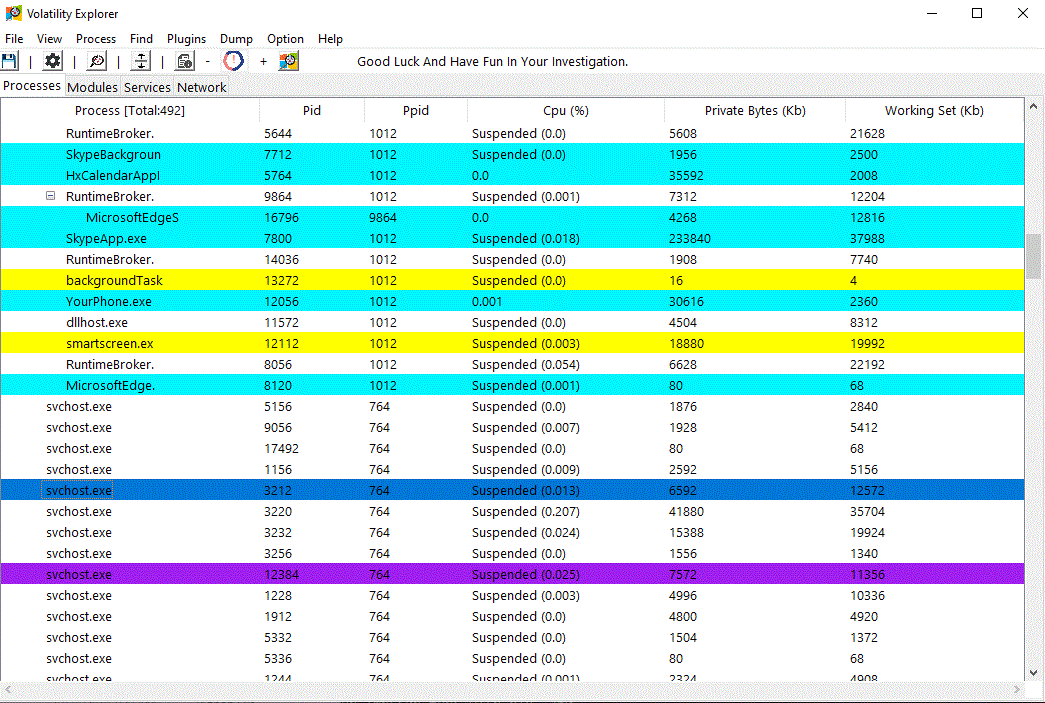
This program allows the user to upload a memory dump and navigate through it with ease using a graphical interface. It can also function as a plugin to the Volatility Framework. This program functions similarly to Process Explorer/Hacker but allows the user to analyze a Memory Dump. This program can run from Windows, Linux, and MacOS machines, but only accepts Windows memory images.
Quick Start
- Download the volexp.py file (git clone https://github.com/memoryforensics1/Vol3xp.git)
- Run as a standalone program or as a plugin to Volatility:
- As a standalone program:
python3 volexp
- As a Volatility plugin:
python3 vol.py -f <memory file path> windows.volexp.volexp
Some Features:
python3 volexp.py
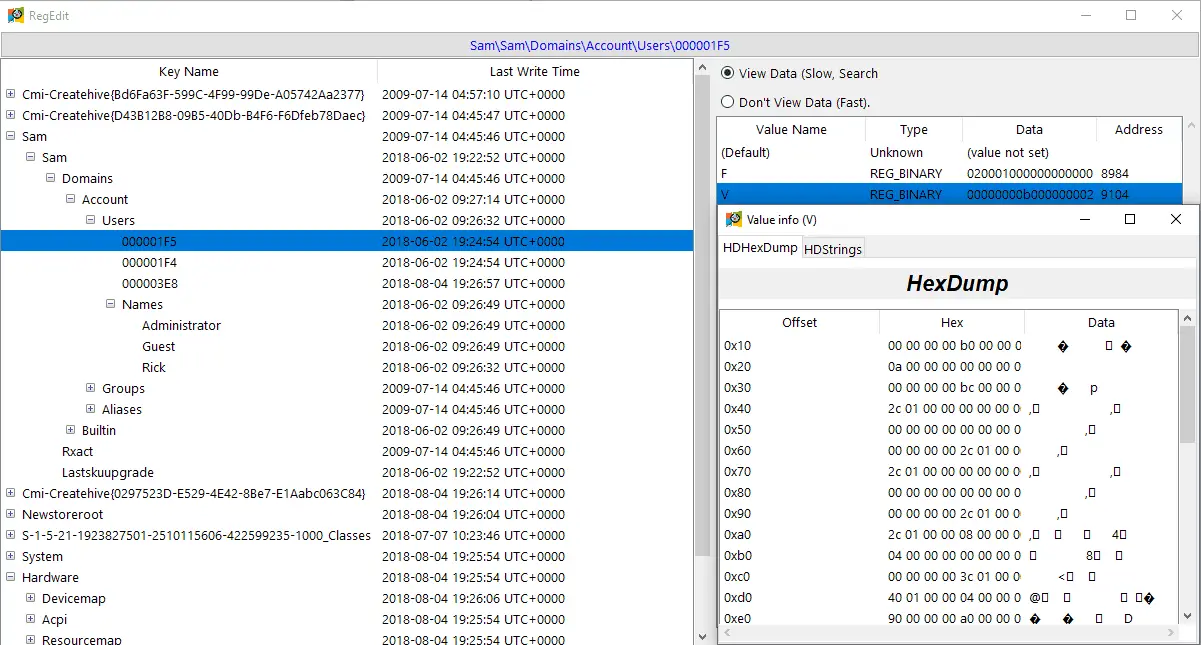
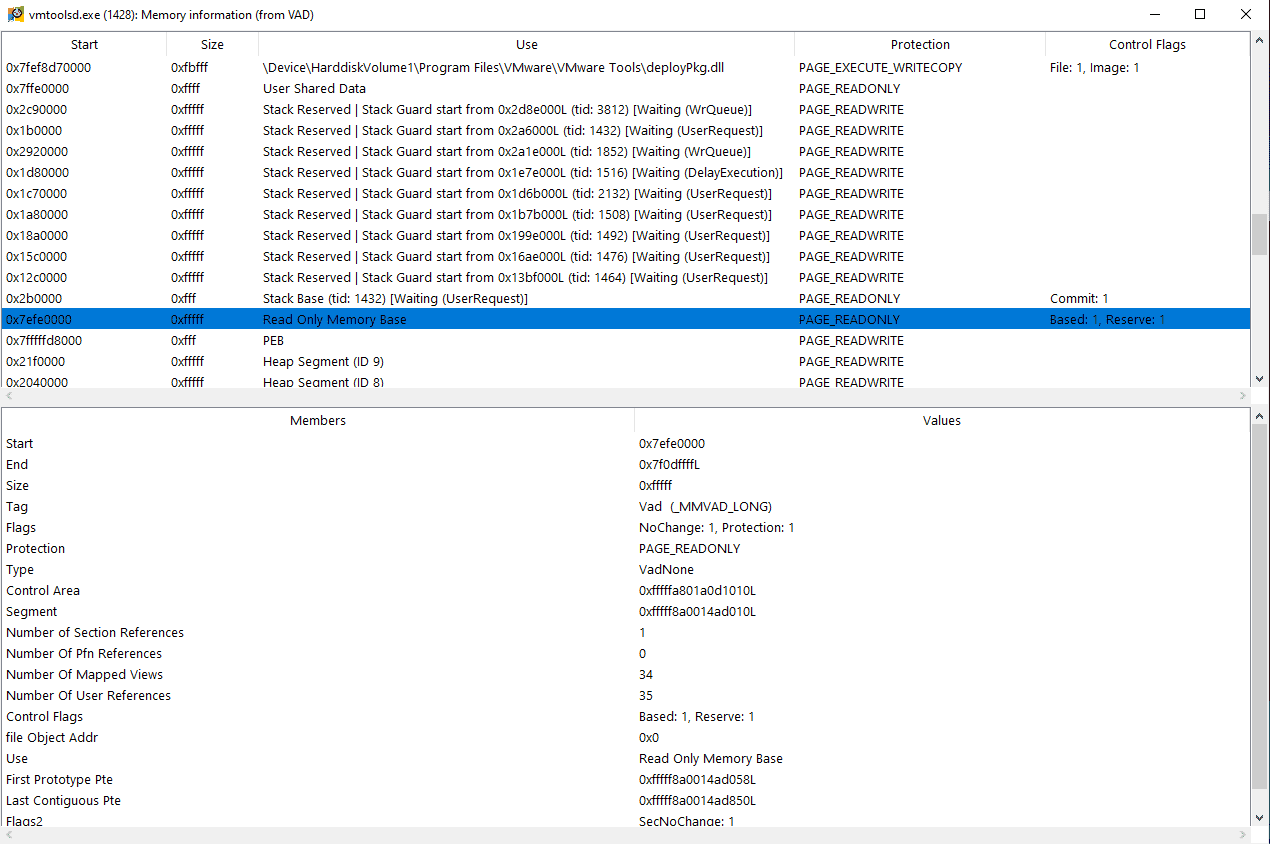
- Some of the information display will not update in real-time (except Processes info(update slowly), real-time functions like struct analyzer, PE properties, run the real-time plugin, etc.).
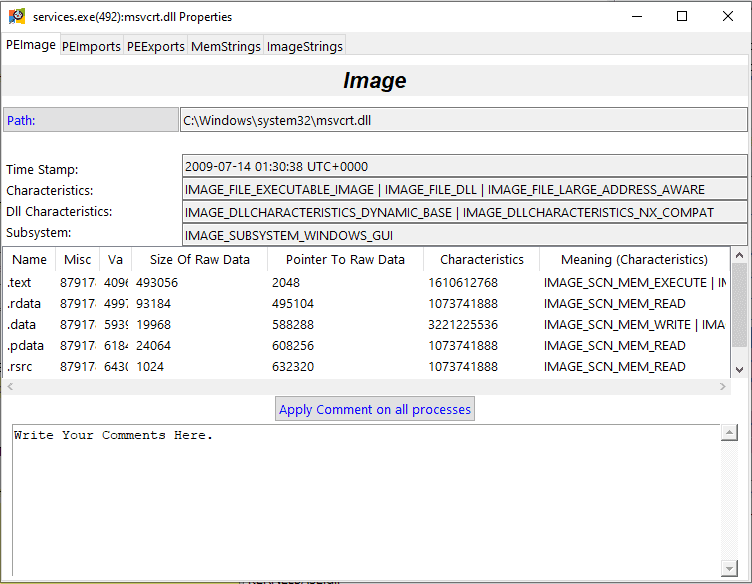
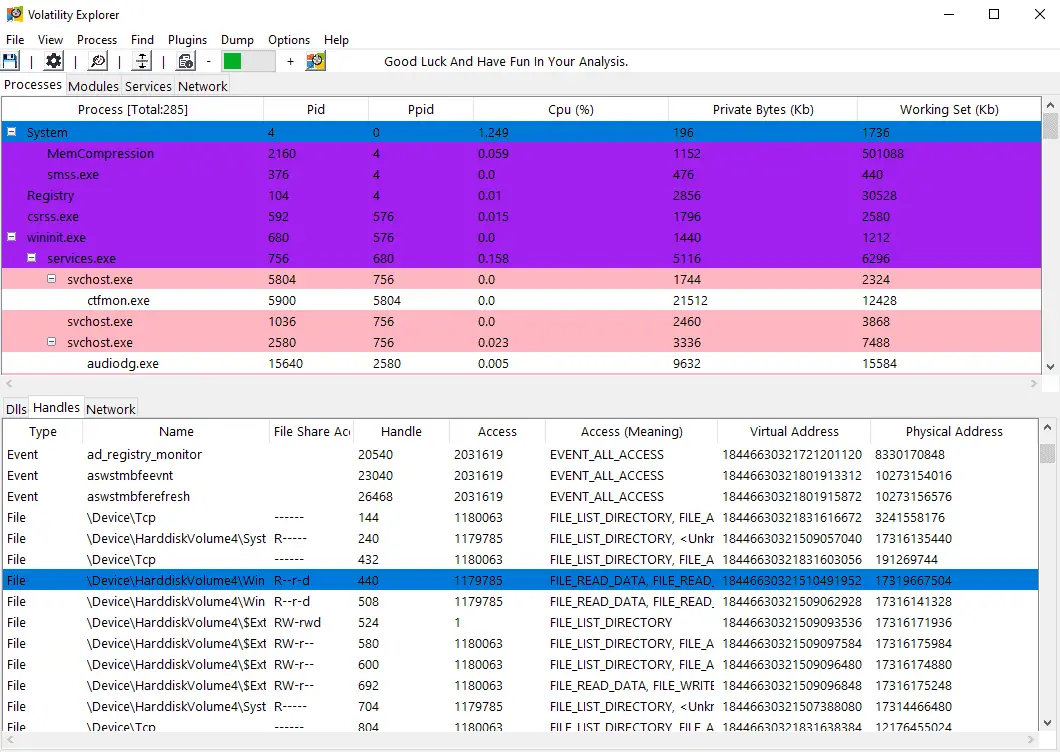
- The program also allows viewing Loaded DLL’s, open handles, and network connections of each process (Access to a dll’s properties is also optional).
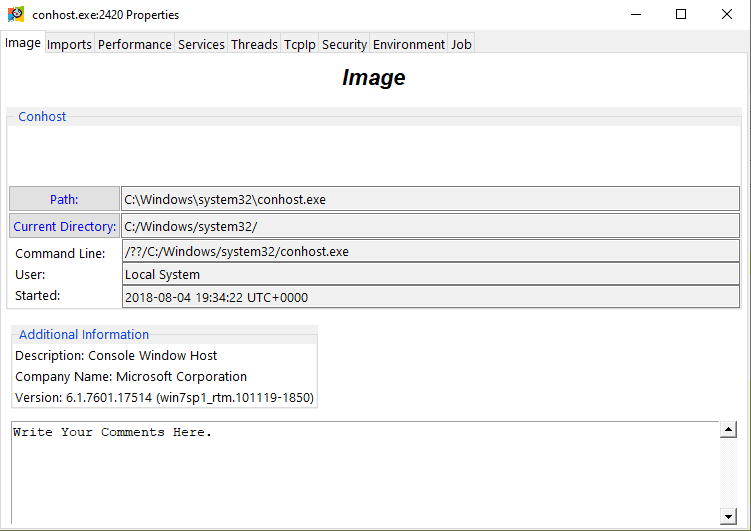
- To present more information on a process, Double-Click (or Left-Click and select Properties) to bring up an information window.
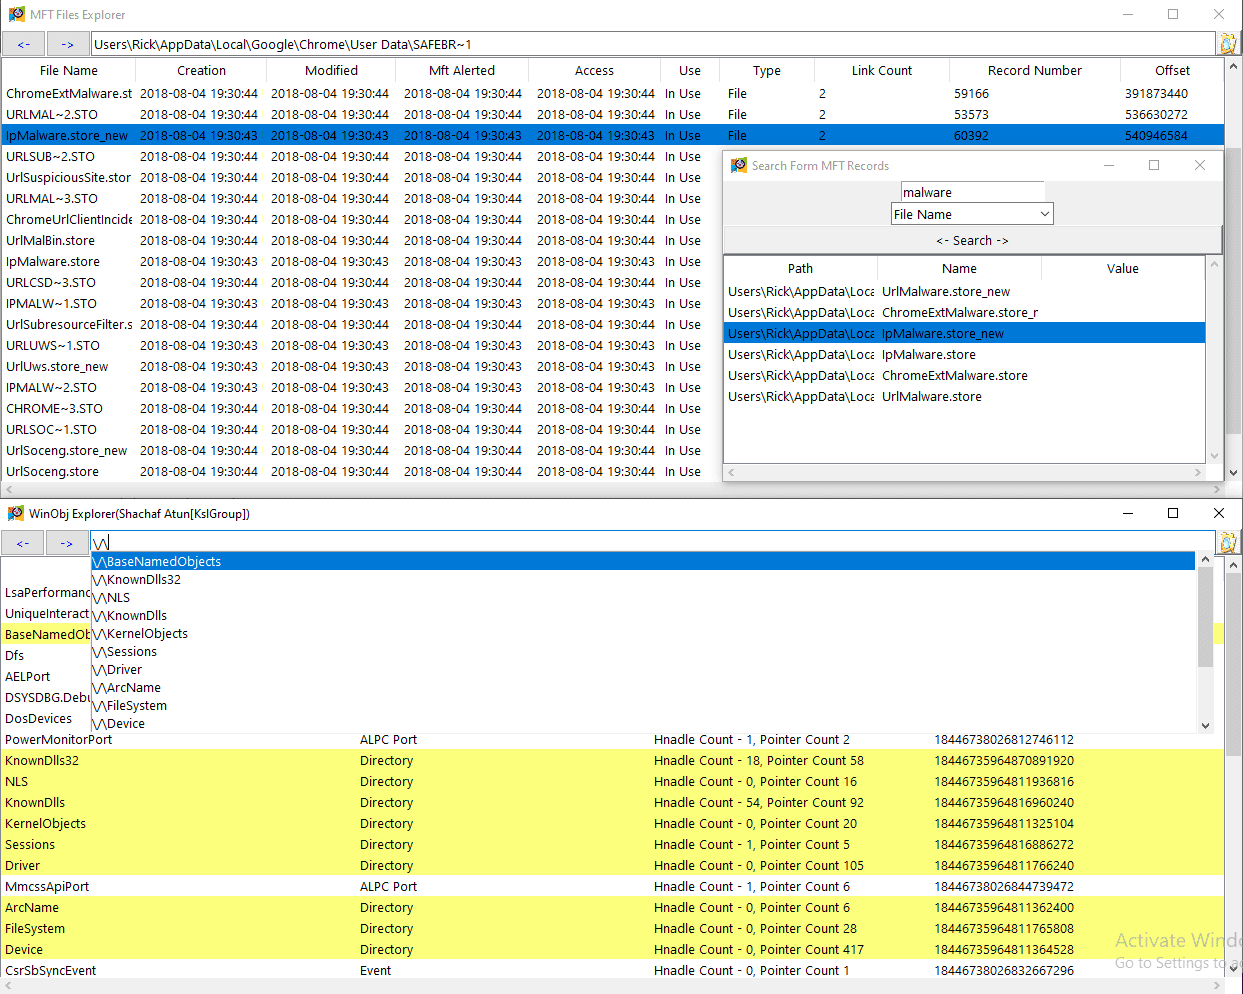
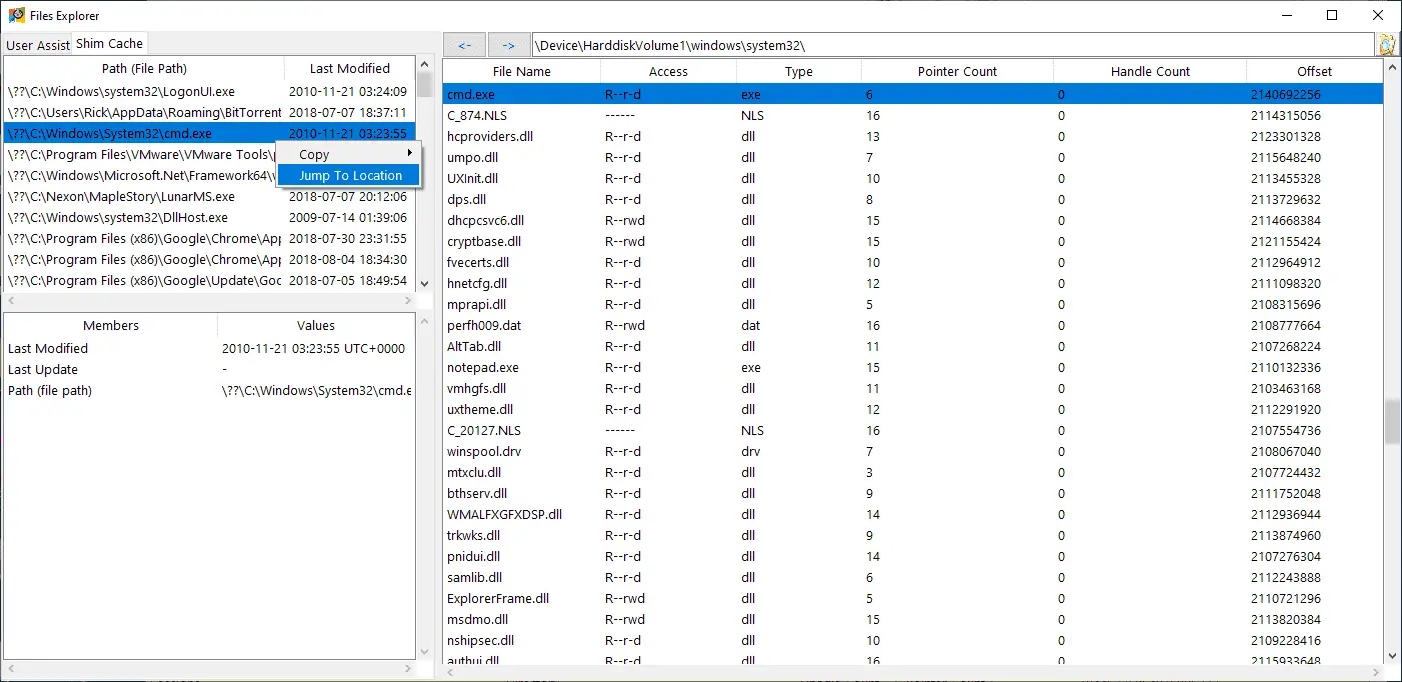
- The program allows the user to view the files in the Memory Dump as well as their information. Additionally, it allows the user to extract those files (HexDump/strings view is also optional).
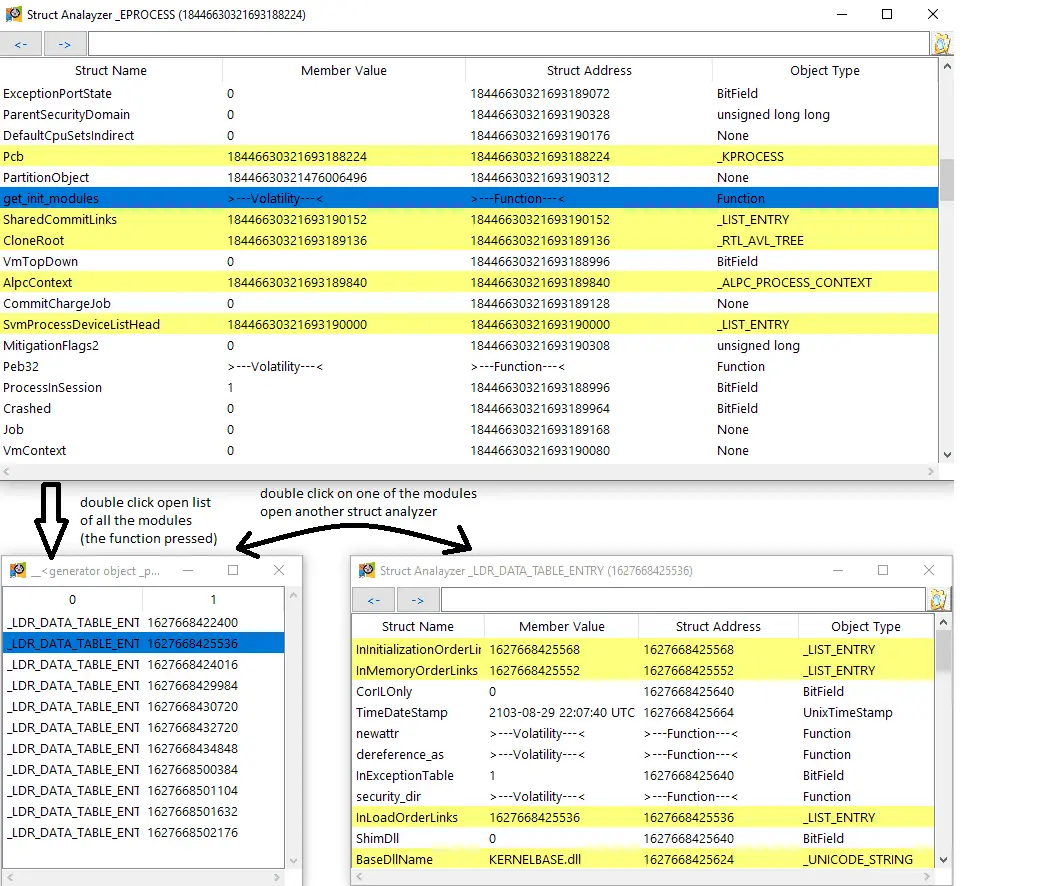
- Additionally, the program supports struct analysis. (writing on the memory’s struct, running Volatility functions on a struct is available). Example of getting all the load modules inside _EPROCESS struct in another struct analyzer window:
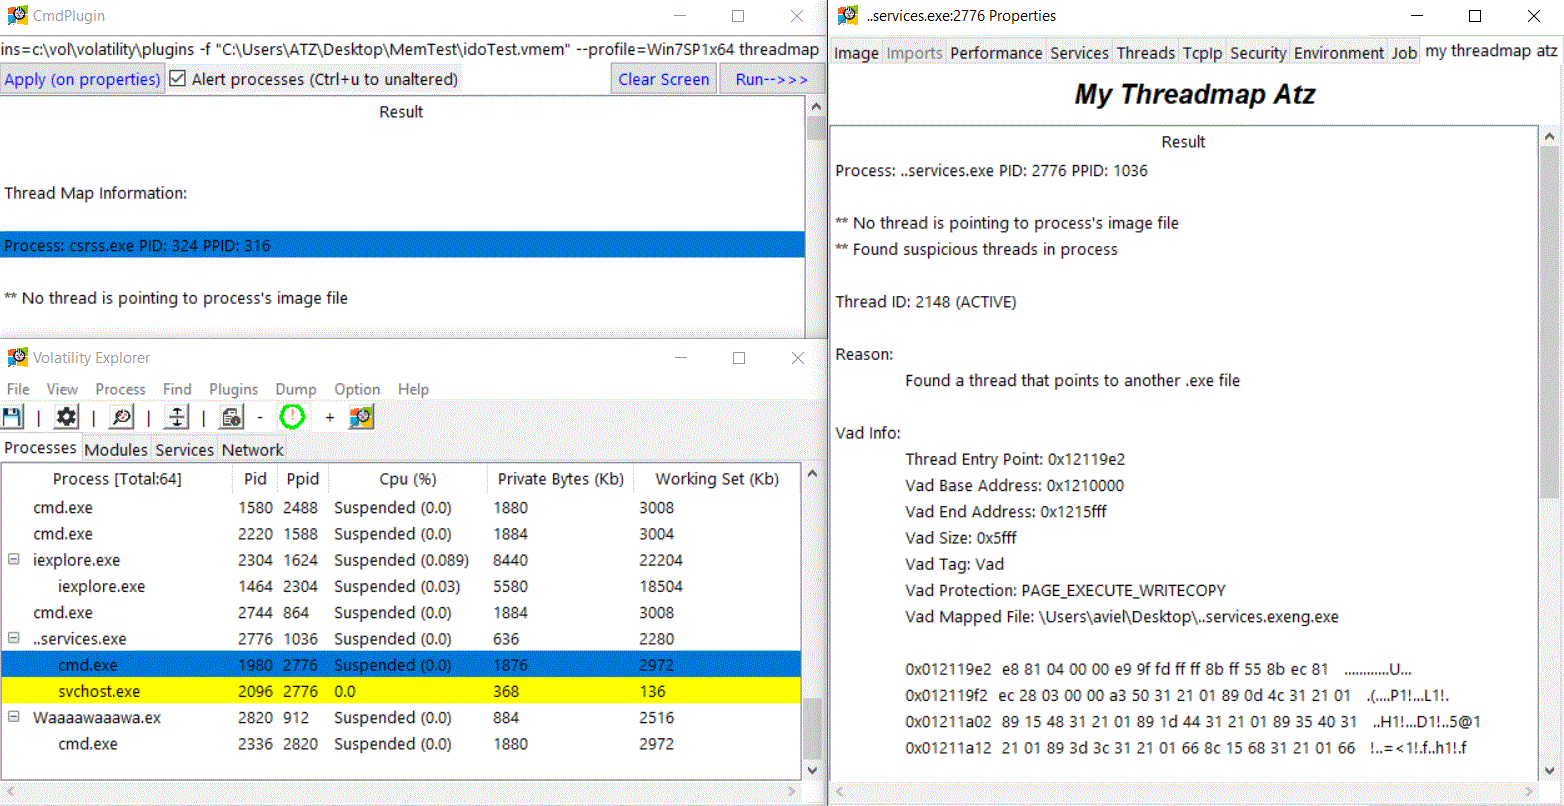
- The Program is also capable of automatically marking suspicious processes found by another plugin. Example of a running threadmap plugin:
- Manually marking a certain process and adding a sidenote on it.
- User’s actions can be saved on a seperate file for later usage.
