graphcat
A simple script to generate graphs and charts on hashcat (and john) potfile and ntds.

Install
git clone https://github.com/Orange-Cyberdefense/graphcat
cd graphcat
pip install .
Use

Graphcat just needs a potfile with -potfile (default is hashcat, but you can use -john to submit a john potfile) and a hashfile with -hashfile. The hashfile should be in a specific format from the 3 available formats with -format flag. The default is Secretsdump.
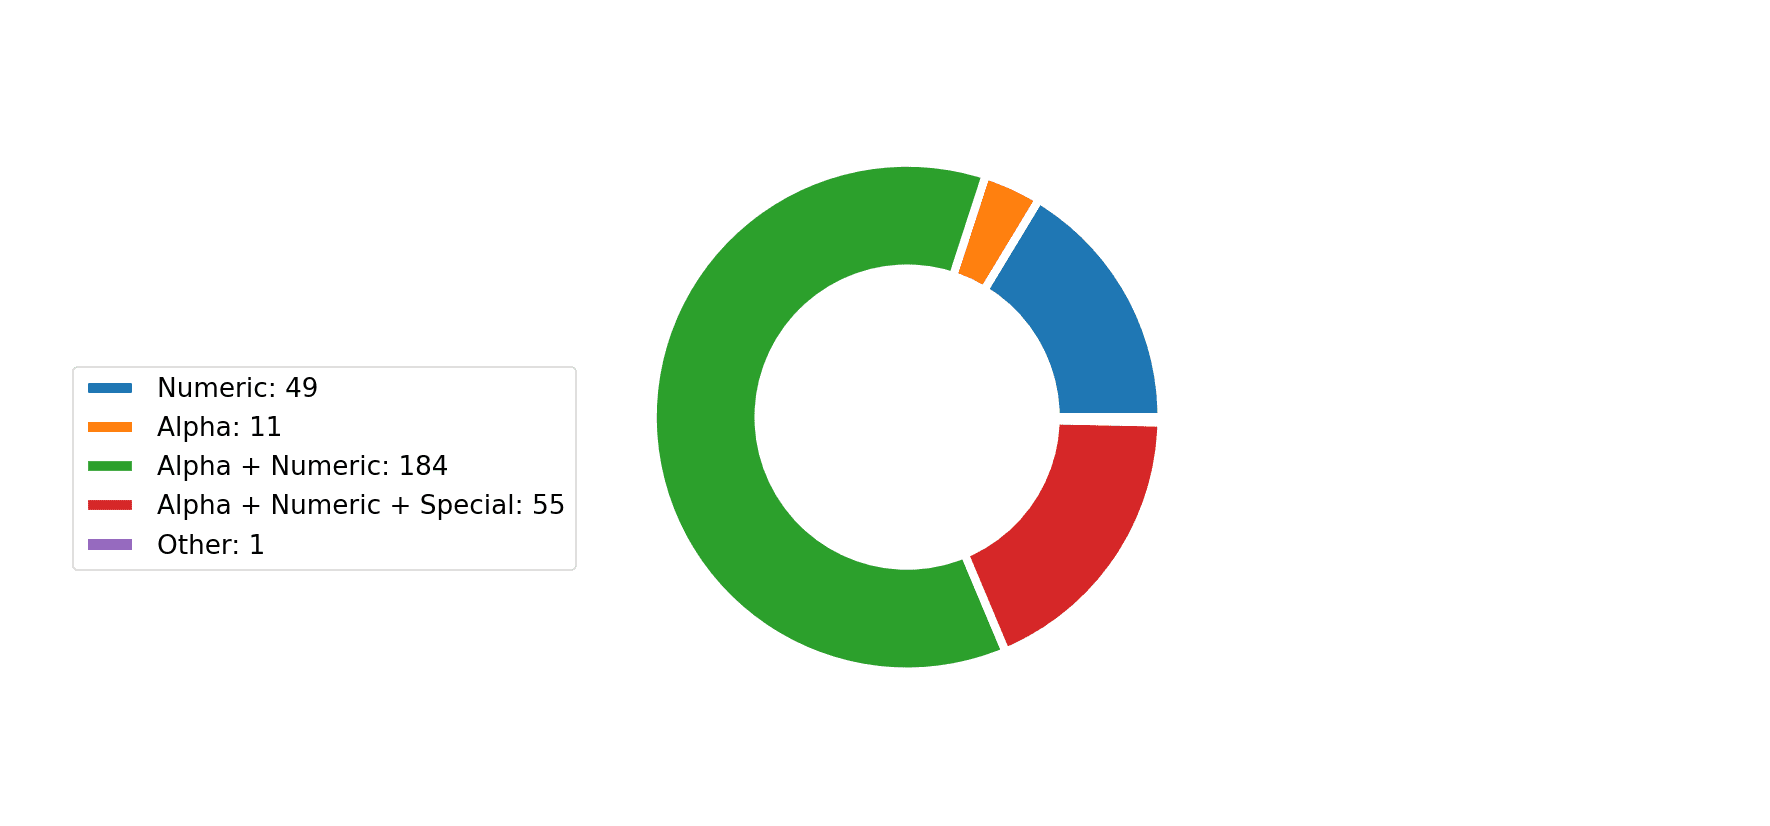
The tool will generate a report with multiple password cracking charts. You can get charts in png with the -export-charts flag.
Formats
1: Only Hash
aad3b435b51404eeaad3b435b51404ee
aad3b435b51404eeaad3b435b51404ee
aad3b435b51404eeaad3b435b51404ee
2: Username + Hash
test1:aad3b435b51404eeaad3b435b51404ee
test2:aad3b435b51404eeaad3b435b51404ee
test3:aad3b435b51404eeaad3b435b51404ee
3: Secretsdump
waza.local\test1:4268:aad3b435b51404eeaad3b435b51404ee:aad3b435b51404eeaad3b435b51404ee:::
waza.local\test2:4269:aad3b435b51404eeaad3b435b51404ee:aad3b435b51404eeaad3b435b51404ee:::
waza.local\test3:4270:aad3b435b51404eeaad3b435b51404ee:aad3b435b51404eeaad3b435b51404ee:::
If a hash occurs more than once in the hash file, it will be counted that many times.
Moreover, if you submit secretsdump with password history (-history in secretsdump command), it will analyze similarity in password history
Copyright (c) 2023 Orange Cyberdefense
Source: https://github.com/Orange-Cyberdefense/