PurpleLab: Revolutionizing Cybersecurity Testing with Speed and Simplicity
What is PurpleLab?
This solution will allow you to easily deploy an entire lab to create/test your detection rules, simulate logs, play tests, download and run malware and mitre attack techniques, restore the sandbox, and many other features.
The lab contains :
- A web interface with a complete front end to control features
- The Virtualbox tool with a ready-to-use Windows 10 VM
- A Flask back-end
- A mysql database
- A pfsense (coming soon)
- A Linux VM (coming soon)
Home Page 🏠
This is the home page, it is composed of several KPIs that are received from the elasticsearch server From this page you can see the number of events from the Windows machine, the number of Unique IPs detected from the log, the number of Mitre Attacks technique/subtechnique, the repartition of your log that is collected from the VM

Hunting Page 🎯
This page redirects you to the Kibana server, go to Discover to check the log of the VM or the log from the simulation page
Mitre Att&ck Page 🛡️
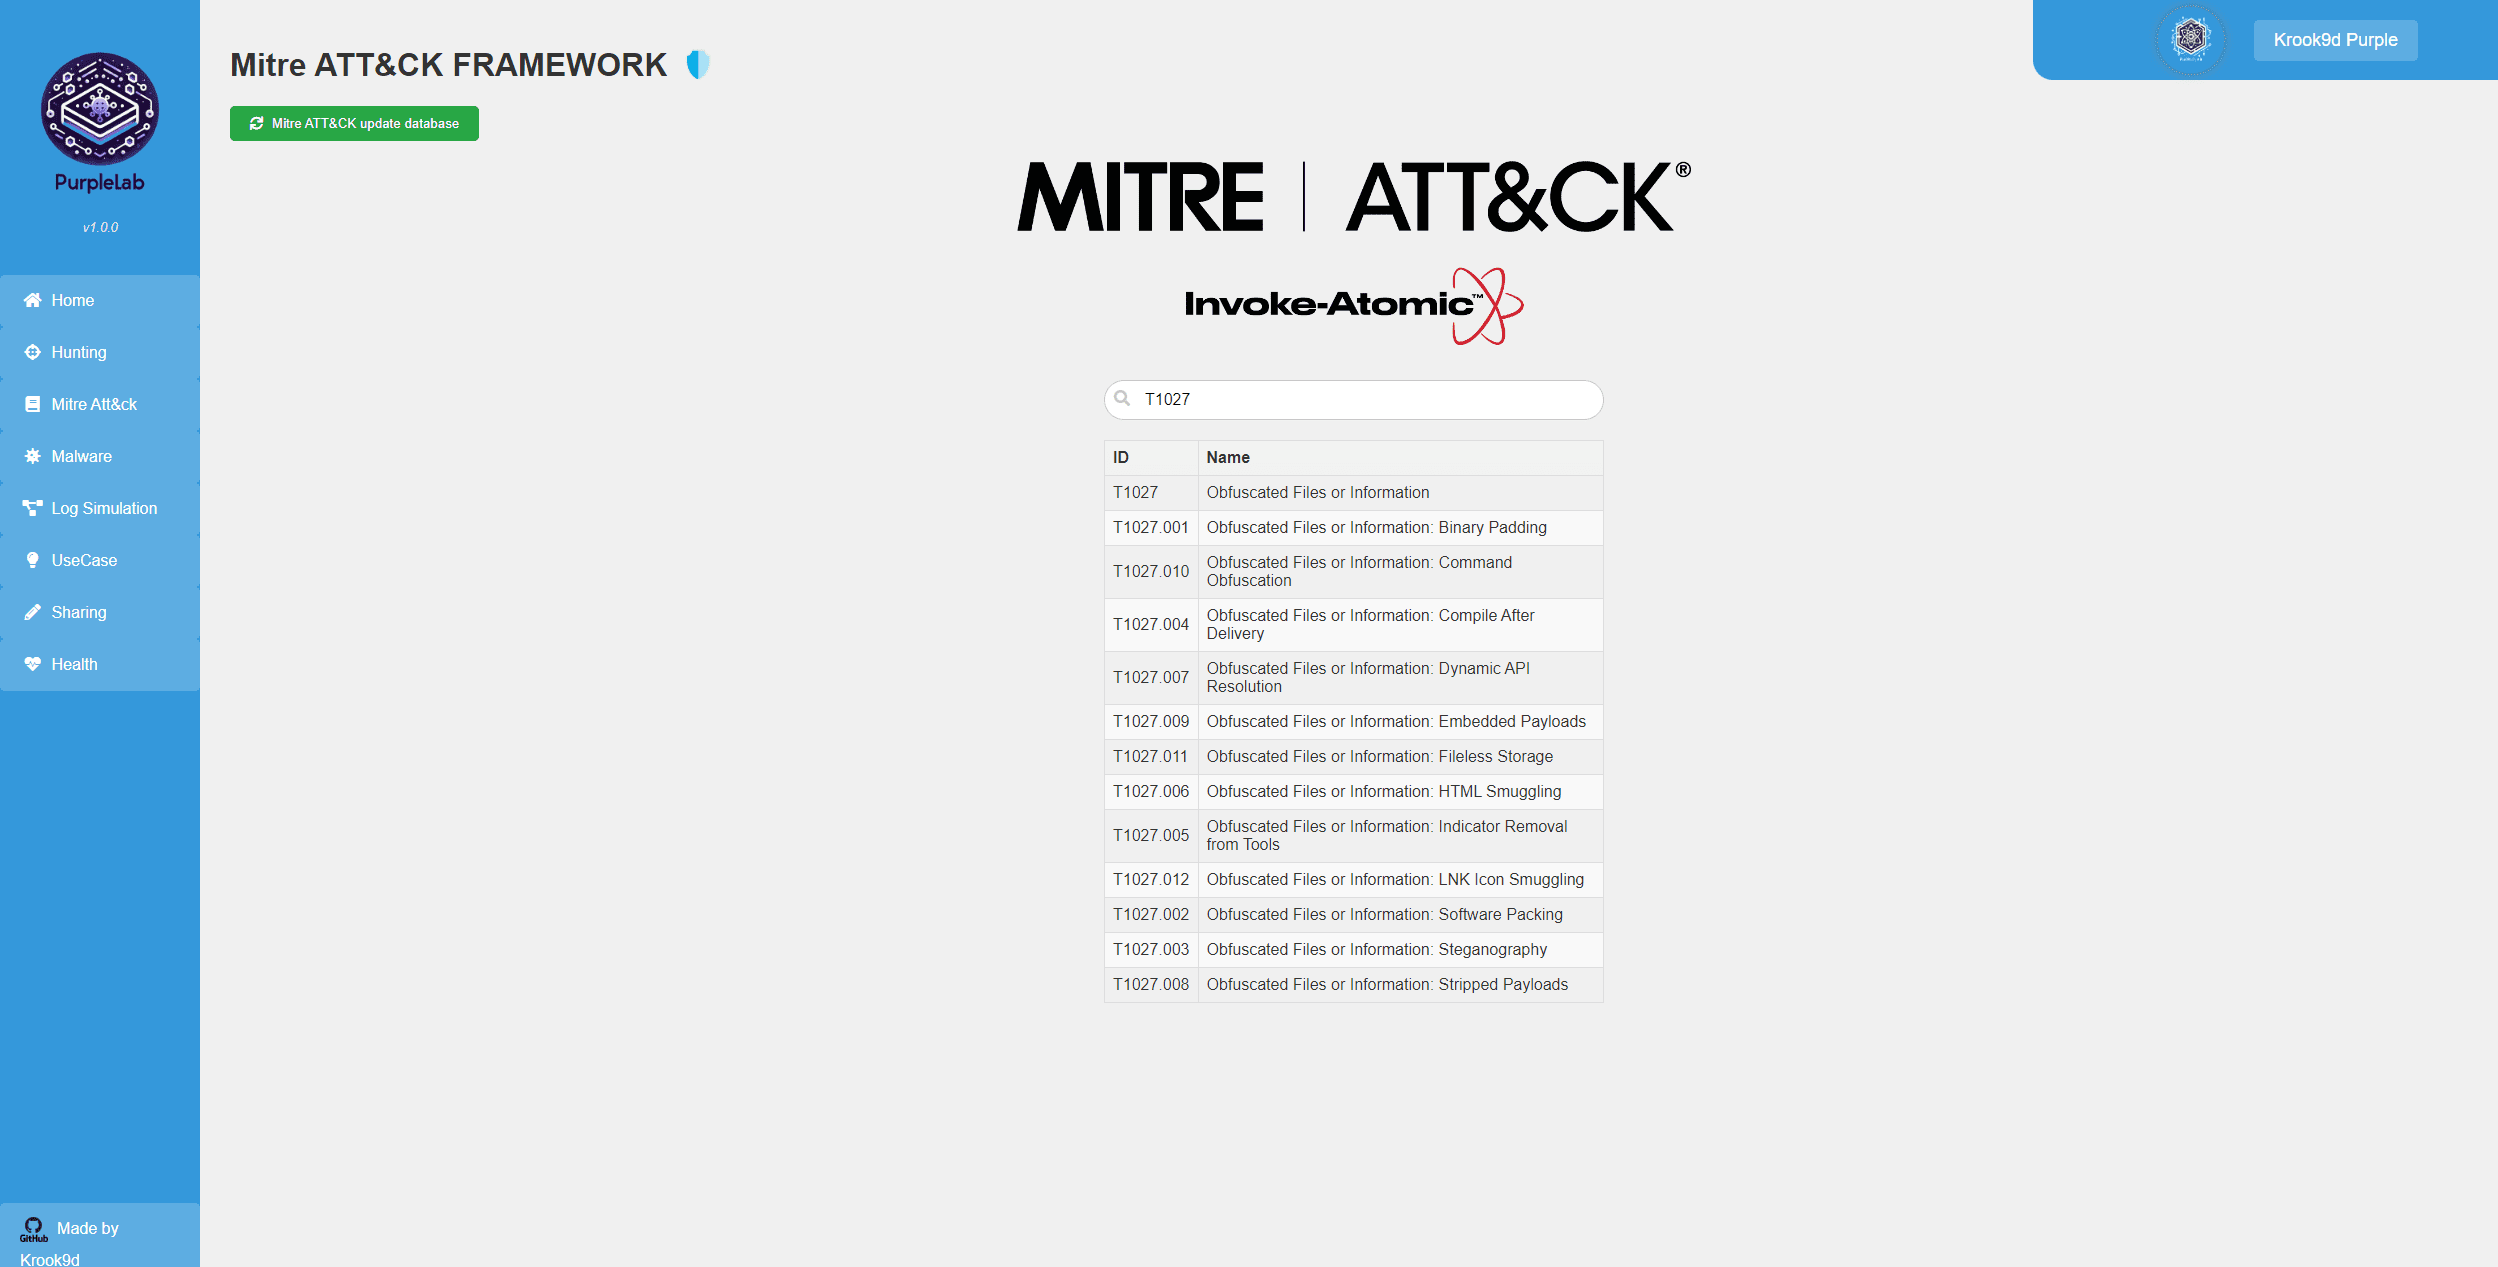
This page is used to list the techniques from the MITRE ATT&CK framework and execute payloads that simulate attacks corresponding to each technique. This is done to create detection rules for each technique.
To search for a technique, you need to enter the first 5 characters of a technique, for example, T1070. The corresponding list for that technique along with its sub-techniques will load. You can then click on a specific technique, and a table with all the information about that technique will appear. At the very end, there is a “run test” button. Clicking on it will execute the payloads associated with that technique on the VM.
The payloads work with the Invoke-Atomic tool, which is installed on the VM. The list of tests for this tool can be found here: https://atomicredteam.io/discovery/
The “Mitre ATT&CK update database” button allows you to update the MITRE ATT&CK framework database with the most recent data.
⚠️ The loading time to display a technique is not instantaneous (2-3 seconds).

Malware Page 🦠
This page is divided into two parts:
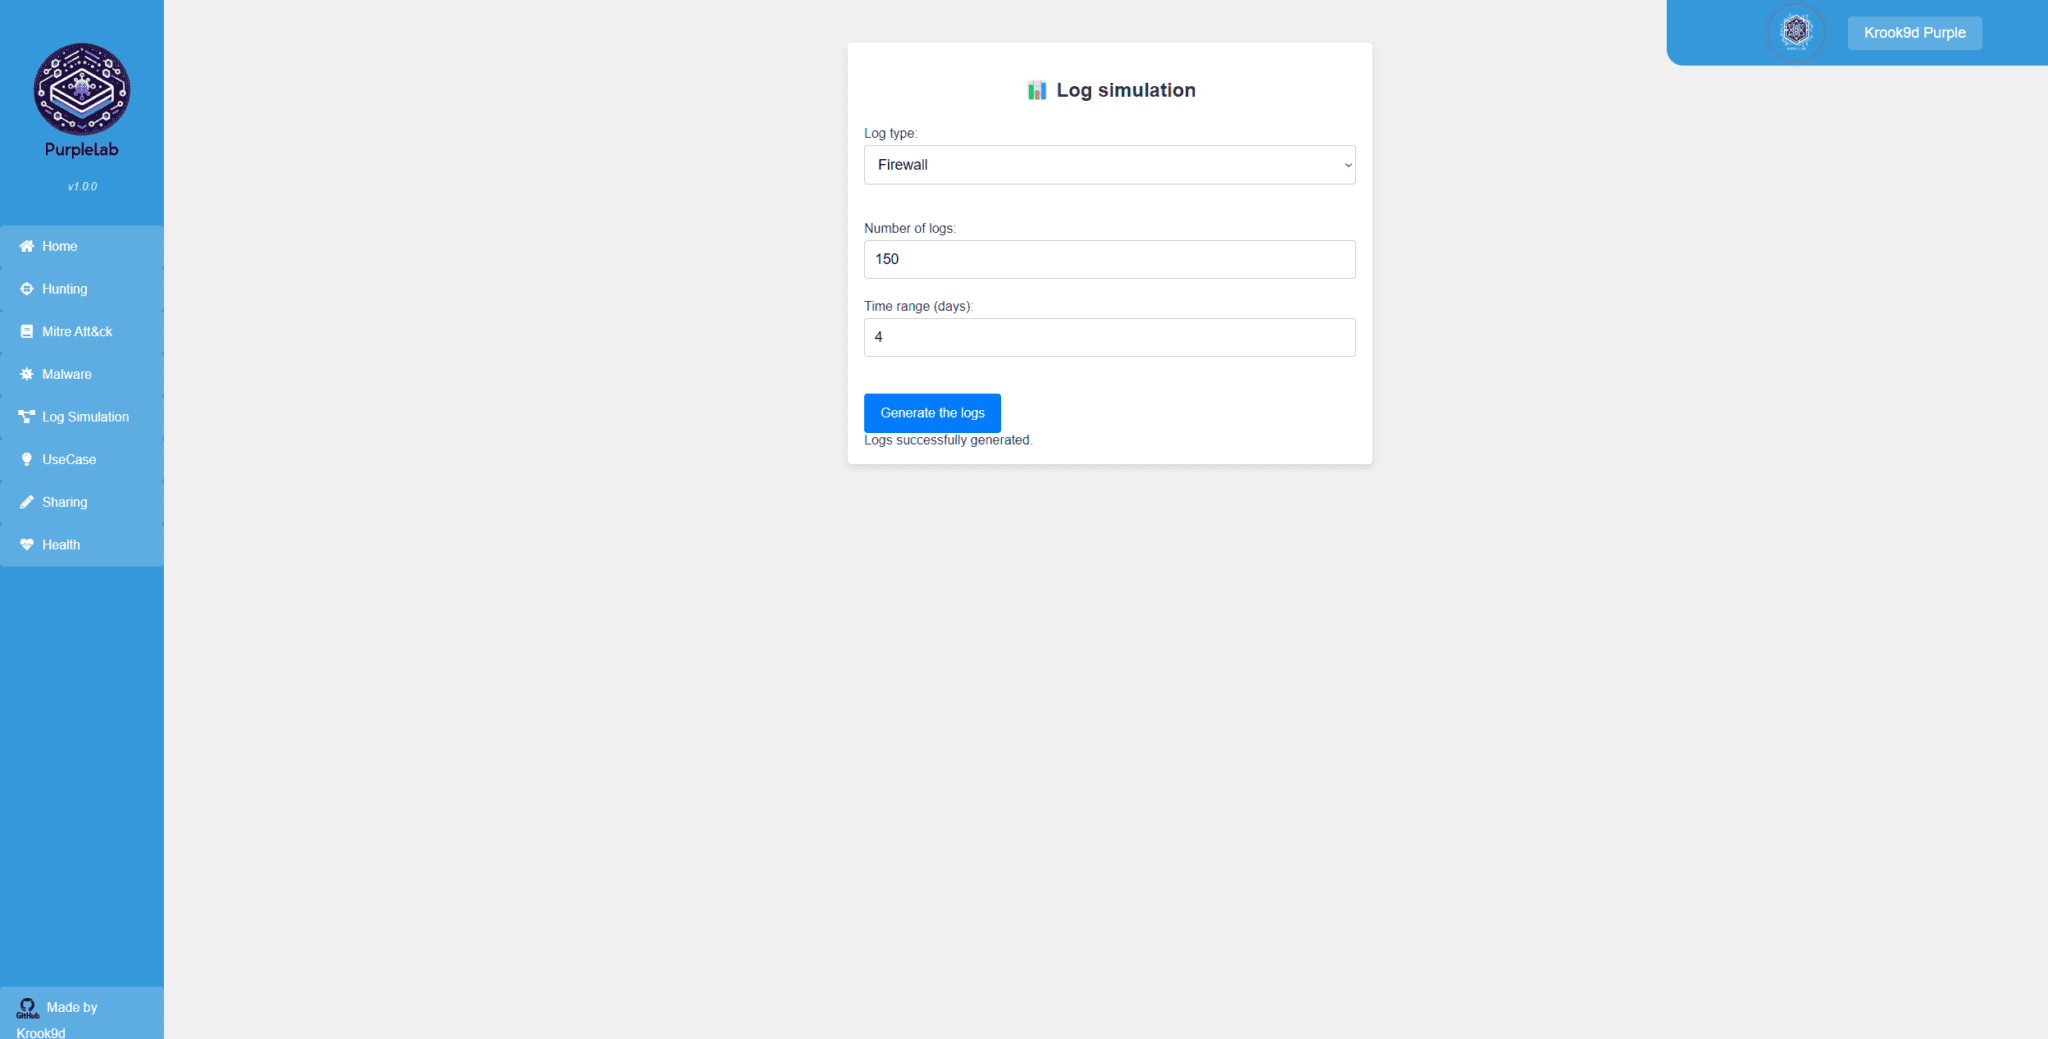
The “Malware Downloader” section allows you to download malware. In the field, enter a type of malware, for example, “Trojan.” This will download the 10 latest malware samples that have been reported on the website https://bazaar.abuse.ch with the tag “Trojan.”
Once the download is complete, the malware is automatically uploaded to the Windows VM. The “Display the content of the CSV” button becomes clickable. By clicking on it, you can view a summary of the downloaded malware and then execute them by clicking on their respective “Run” buttons.
The “Malware Uploader” section allows you to upload your executables, scripts, DLLs, etc.
⚠️Please note that the accepted file extensions are as follows: .exe, .dll, .bin, .py, .ps1.
The submitted executable is uploaded to the VM, and you can then click on “List of hosted malware” to display the available uploaded executables.
Note: Malware is downloaded to the VM from the /var/www/html/Downloaded/malware_upload/ directory.
Log simulation Page 📊
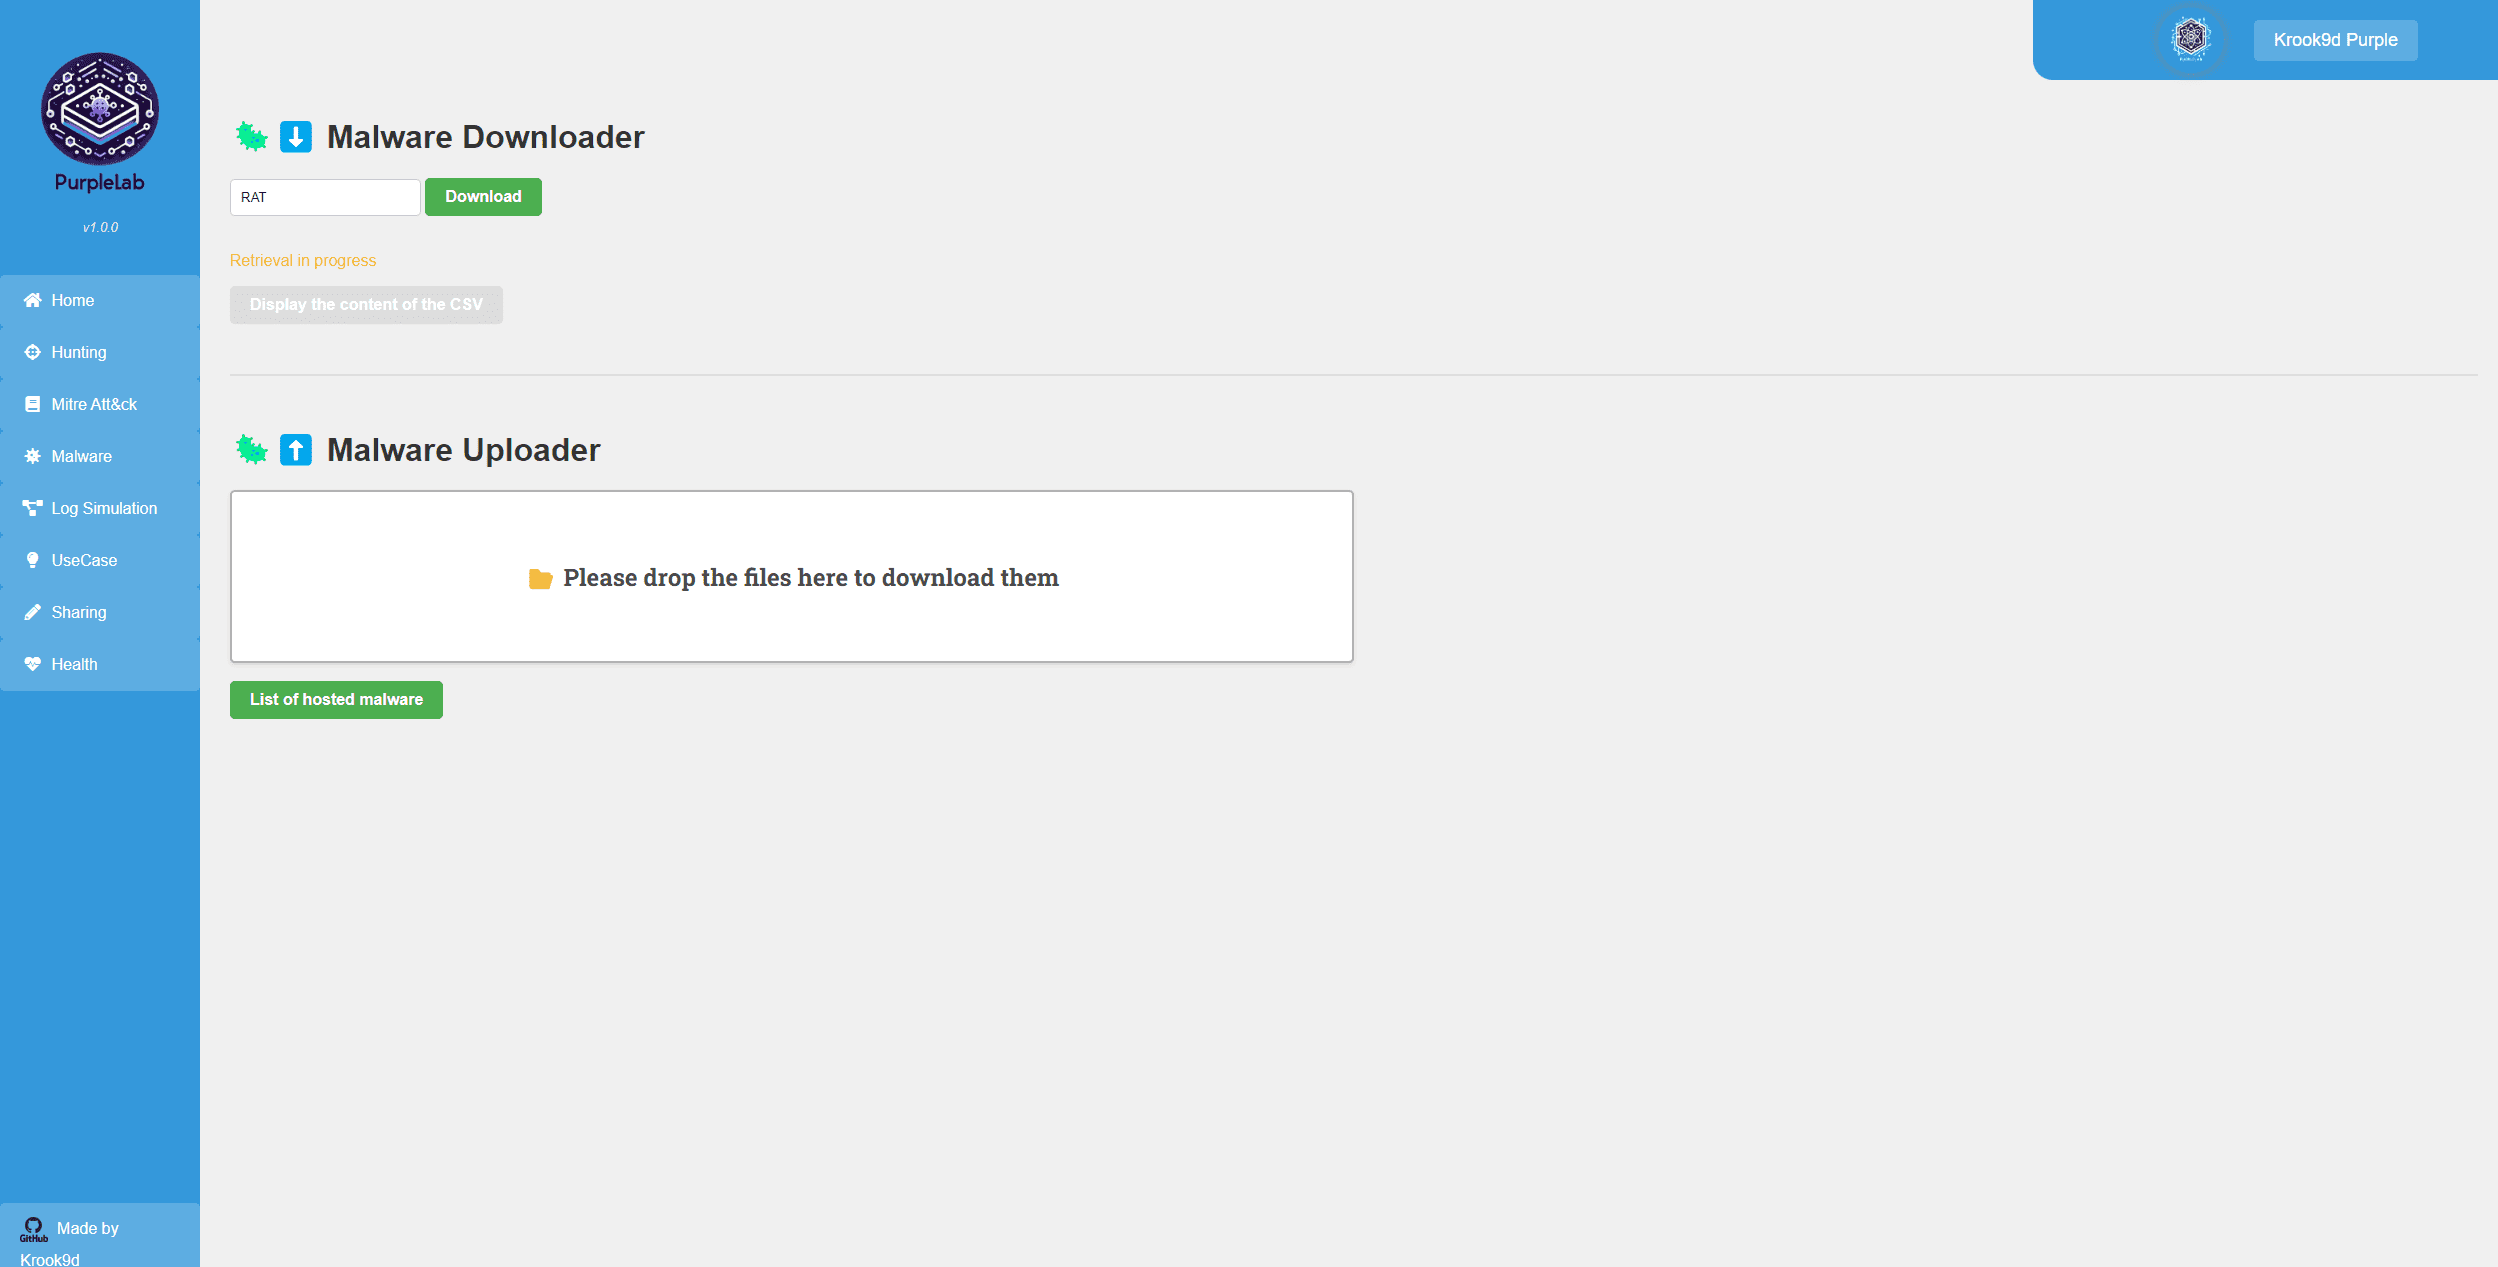
This page allows you to simulate logs to create more realistic traffic for log analysis. It also provides an opportunity to practice detecting suspicious behavior concealed within legitimate traffic.
Currently, two types of logs are offered in the current version:
Ubuntu Log (under construction) Firewall Log (functional) You can then choose the number of logs to generate and the time range for timestamping the logs.
The logs have randomized values; for example, the firewall logs will have different IP addresses, “Deny” and “Accept” values assigned randomly, as well as other fields.
Once the fields are filled and the button is clicked, the logs will be generated, and you can find them in the SIEM.
Note : The logs are generated in JSON format with names like firewall.json or ubuntu.json and are located at path =
/var/www/html/Downloaded/Log_simulation
Usage Case Page 🧩
This page allows you to play out custom-made use cases from start to finish, replicating a compromise scenario. Currently, two use cases are available.
Once a use case is selected, there are two buttons: one to execute the use case on the VM and another to display the use case details.
The details will provide you with a step-by-step scenario of the use case, the actions taken, and any IOCs (Indicators of Compromise). For an added challenge, try to trace the entire compromise path by analyzing the logs before displaying the details 😊

Sharing Page ✏️
This page is a simple sharing platform. When you have found a good query or detection rule, you can publish it on this shared page to benefit other analysts, and vice versa.

Health Page 🩺
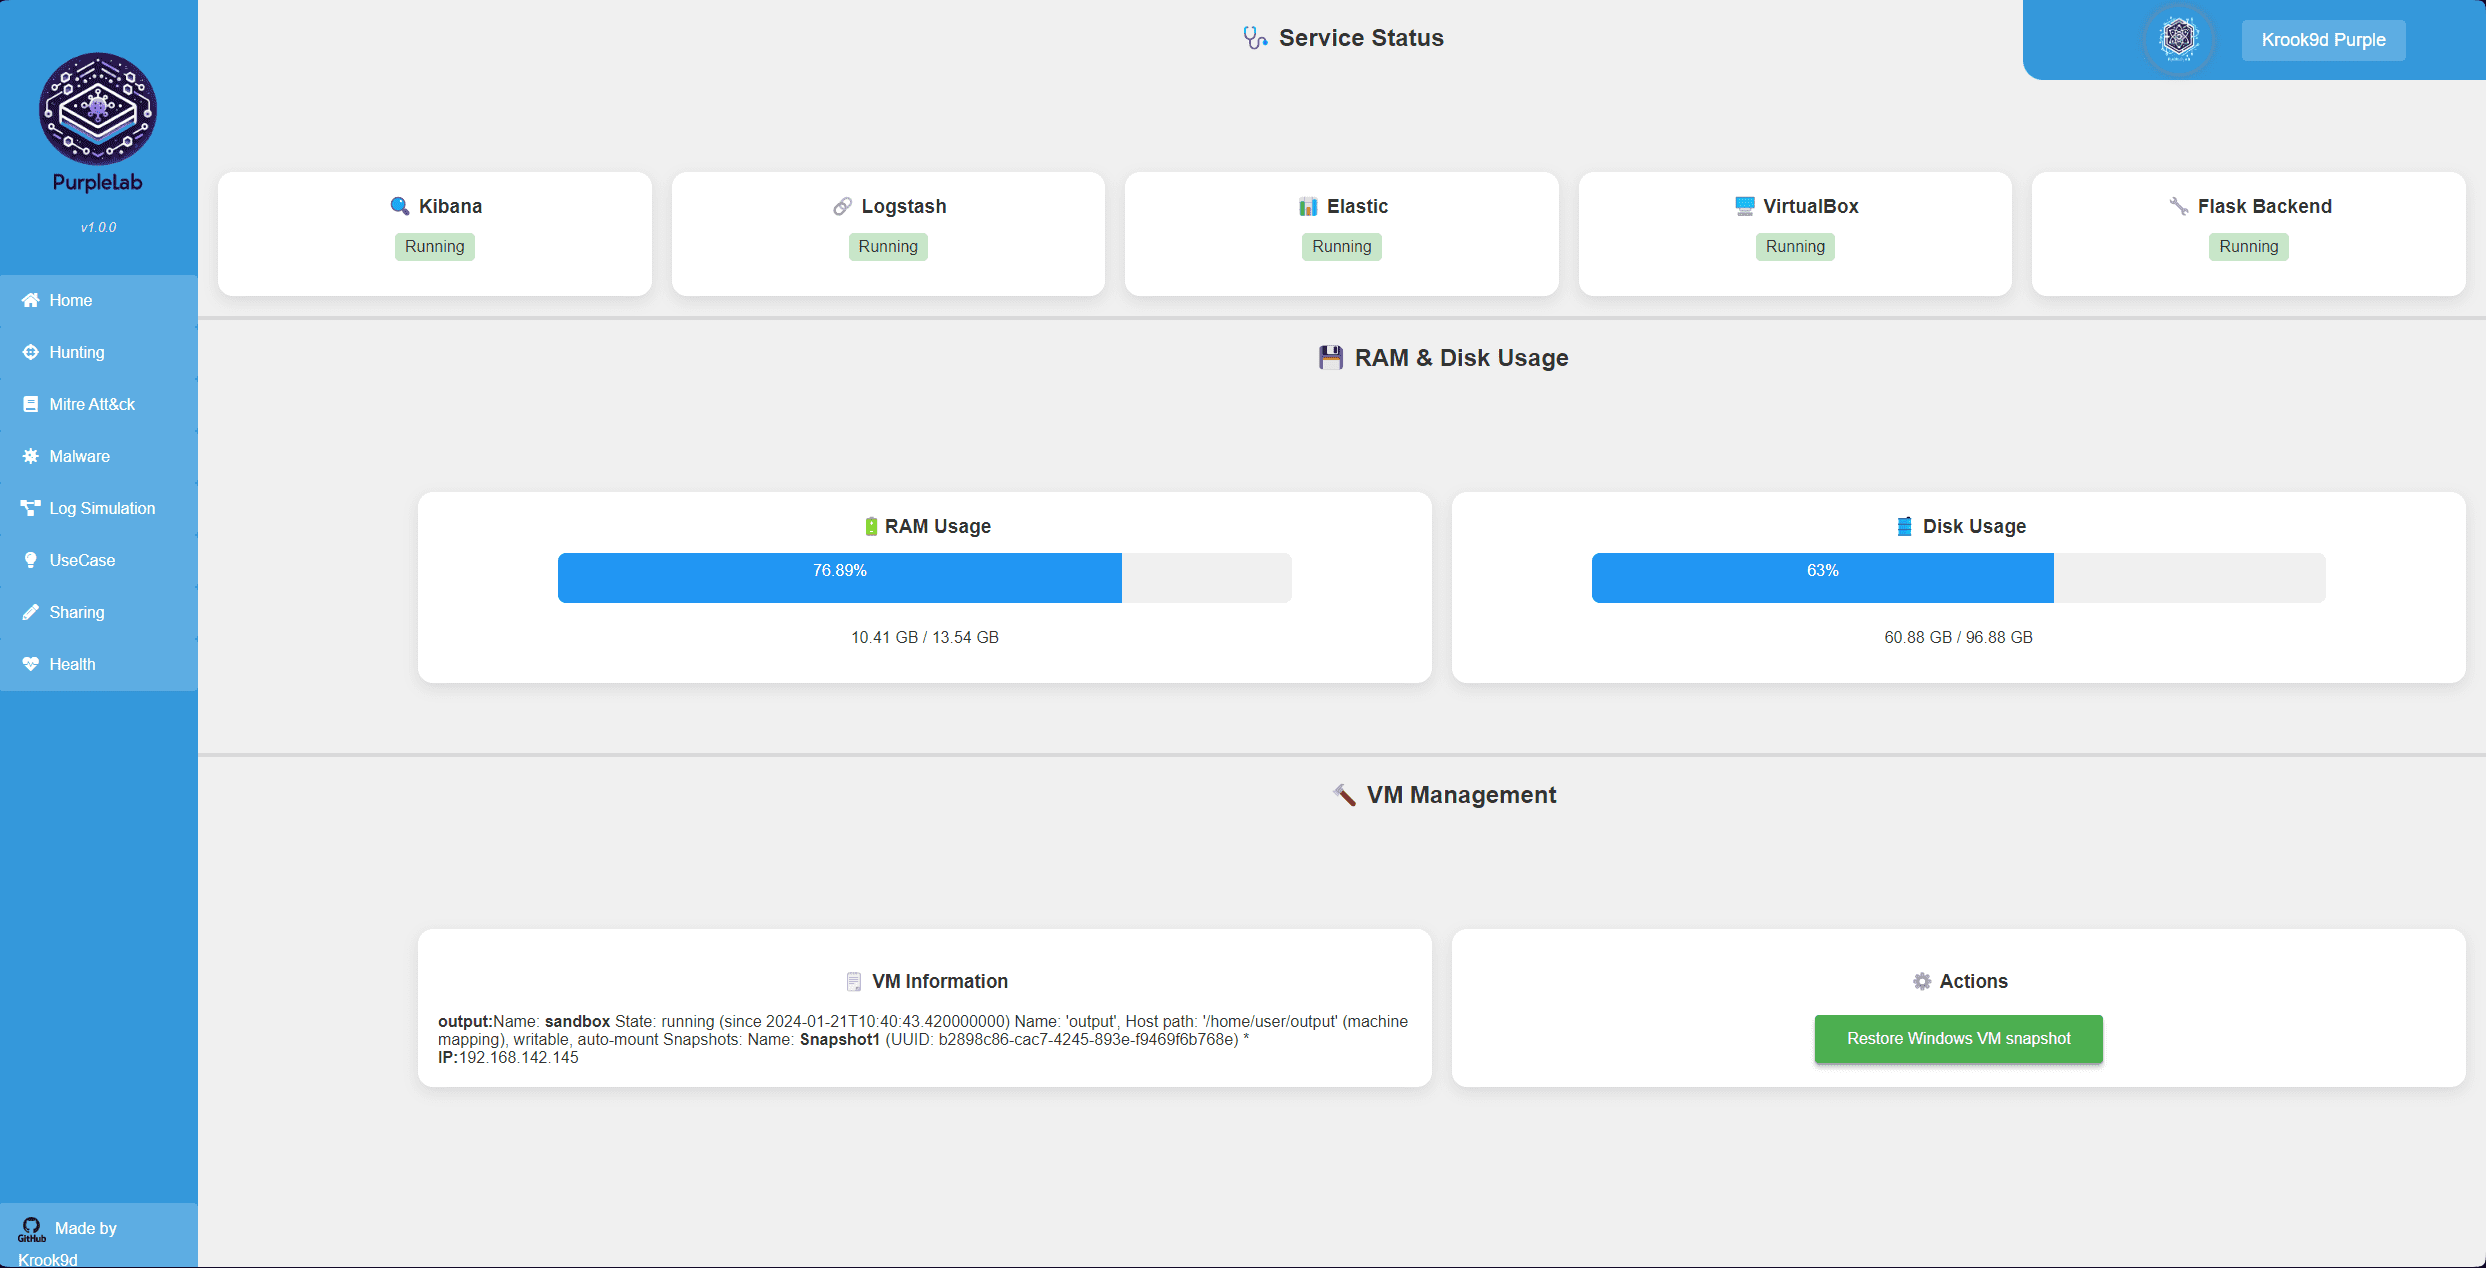
This page allows you to monitor all the components and resources of the PurpleLab tool.
First, you will see the status of the following components:
Kibana Logstash Elastic VirtualBox Flask Backend Then, you can check the RAM and disk usage.
Next, you will find information about the VM, including its status, IP address, and snapshot.
Finally, there is a button to restore the VM.
⚠️ Sometimes, the restoration of the VM snapshot is reported with an error even though it is successfully completed. Please confirm this by connecting to the VM.
Install & Use
Copyright (C) 2024 Krook9d


