nightingale v6.7.1 releases: enterprise-level cloud-native monitoring system
Nightingale
Nightingale is an enterprise-level cloud-native monitoring system, which can be used as a drop-in replacement for Prometheus for alerting and management.
Nightingale is a cloud-native monitoring system by All-In-On design, that supports enterprise-class functional features with an out-of-the-box experience. We recommend upgrading yourPrometheus + AlertManager + Grafana combo solution to Nightingale.
- Multiple prometheus data sources management: manage all alerts and dashboards in one centralized visually view;
- Out-of-the-box alert rule: built-in multiple alert rules, reuse alert rules template by one-click import with a detailed explanation of metrics;
- Multiple modes for visualizing data: out-of-the-box dashboards, instance customize views, expression browser, and Grafana integration;
- Multiple collection clients: support using Prometheus Exporter、Telegraf、Datadog Agent to collect metrics;
- Integration of multiple storage: support Prometheus, M3DB, VictoriaMetrics, Influxdb, TDEngine as storage solutions, and original support for PromQL;
- Fault self-healing: support the ability to self-heal from failures by configuring webhook;
If you are using Prometheus and have one or more of the following requirement scenarios, it is recommended that you upgrade to Nightingale:
- Multiple systems such as Prometheus, Alertmanager, Grafana, etc. are fragmented and lack a unified view, and cannot be used out of the box;
- The way to manage Prometheus and Alertmanager by modifying configuration files has a big learning curve and is difficult to collaborate;
- Too much data to scale-up your Prometheus cluster;
- Multiple Prometheus clusters running in production environments, which faced high management and usage costs;
If you are using Zabbix and have the following scenarios, it is recommended that you upgrade to Nightingale:
- Monitoring too much data and wanting a better scalable solution;
- A high learning curve and a desire for better efficiency of collaborative use in a multi-person, multi-team model;
- Microservice and cloud-native architectures with variable monitoring data lifecycles and high monitoring data dimension bases, which are not easily adaptable to the Zabbix data model;
If you are using open-falcon, we recommend you to upgrade to Nightingale:
- For more information about open-falcon and Nightingale, please refer to read Ten features and trends of cloud-native monitoring。
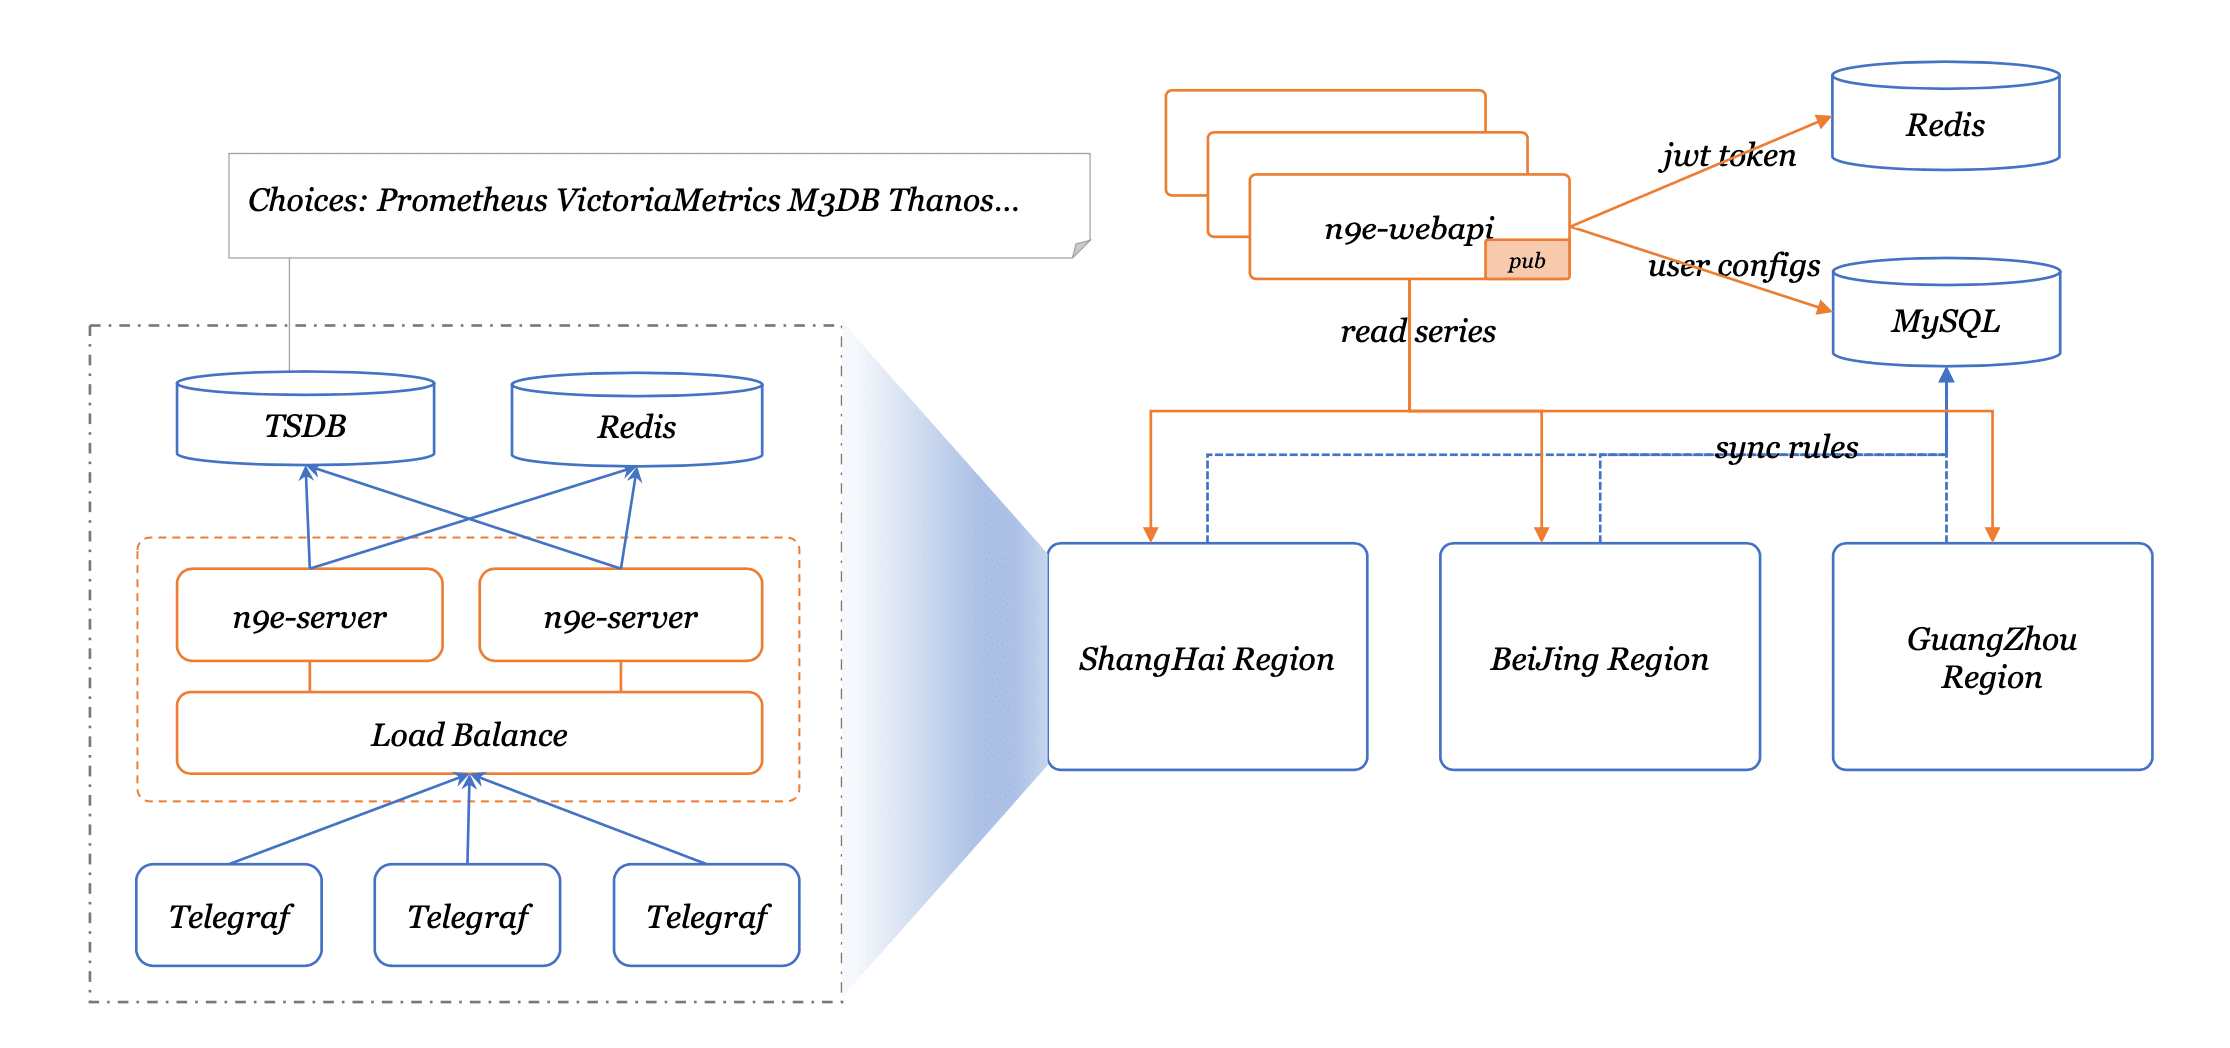
A typical Nightingale deployment architecture
Changelog v6.7
- feat: Support for viewing richer machine meta information (categraf needs to be upgraded to version v0.3.42)
- feat: Support for setting heartbeats updated with ident information extracted from specified time-series metrics
- feat: Enhanced self-protection capability, support for discarding monitoring data based on specified labels
- feat: Alarm notifications, support for more template functions
- feat: Dashboard table graph aggregation dimension mode supports sorting based on query conditions
- feat: Alarm rule Prometheus source adds query preview feature
- perf: PromQL input box supports autocomplete hints for dashboard variables, adapted to global variable syntax like $_interval
- perf: Dashboard variable values updated, recalculating repeat panels no longer requires refreshing the page
- perf: Local cache for dashboard theme state
- perf: Elasticsearch real-time query date field default value optimization, defaults to the first field of date type
- perf: Added sorting function to the name and update time columns of alarm rules and recording rules
- refactor: Menu adjustment, moving metrics and logs queries under the dashboard
- refactor: Alarm rule additional information key changed from Chinese to English
- refactor: Dashboard Elasticsearch source’s variable definition generated DSL no longer adds .keyword to field
- fix: Fixed the issue of no data query when switching from all nodes to a specific node in the machine list
- fix: Fixed the issue of the page crashing after entering illegal characters in the dashboard variable regex filter input box
- fix: After renaming the business group, the business group in alarm events was not updated in time
Install & Use
Copyright (C) 2017 Beijing Didi Infinity Technology and Development Co., Ltd. All rights reserved.